Twitter (or X, as it’s now known) is hard to keep up with at the best of times. Sometimes it’s a “global town square,” and sometimes it’s just a group chat that got out of control. Over the course of 2020-2025, the platform grew, faltered, pivoted, and carried on regardless.
Table of Contents
More people joined (allegedly), new revenue streams emerged, and the platform morphed into something else… possibly.
Twitter is still one of the most popular social media platforms in the world, even if it’s not the biggest. That’s according to recent data from Statista, DataReportal, and Pew Research Center.
Perhaps more importantly, though, it’s one of the most influential. In this article, we’ll explore what the heck has happened to Twitter between 2020 and 2025, from audience demographics to revenue growth, engagement patterns, and more.
Twitter (X) User Growth 2020 to 2025: How Many People Use the Platform Today?
How many users does Twitter (now X) have? Twitter has never grown like a “typical” social media platform. So when you ask, “How many people use Twitter today?” The answer is, well, it depends. In 2020, Twitter had 192 million monetizable daily active users (mDAUs).
By 2021, this number had grown to 217 million, according to Statista. The COVID-19 pandemic drove a massive increase in social media use in general and Twitter, in particular, was no exception.
In 2022, Twitter had around 237.8 million mDAUs, according to Twitter Investor Relations. This is the last officially reported year of Twitter user growth before the Elon Musk era.
Estimated Twitter (X) Users: 2020 to 2025
So how many people are using Twitter in 2023? Since Elon Musk took over the platform, less information is available about Twitter’s users. In this case, we will have to rely on third-party estimates, which are not always in agreement.
| Year | Estimated Users (mDAUs / Active Users) |
|---|---|
| 2020 | ~192 million (mDAUs) |
| 2021 | ~217 million (mDAUs) |
| 2022 | ~238 million (mDAUs) |
| 2023 | ~368 million (estimated total users) |
| 2024 | ~421 million (estimated total users) |
| 2025 | ~440–500 million (projected) |
Business of Apps: Twitter had around 368 million users in 2023, and is expected to grow in 2024 and 2025. DemandSage: Twitter may have more than 440 million users by 2025.
Now here’s the part where things get a bit complicated and frustrating if you like clean data. The older figures are talking about daily active, monetizable users, whereas the later figures are talking about total users or monthly users. Which isn’t the same thing.
It’s the difference between people who go to the gym every day, and everyone who has a gym membership but hasn’t been since they signed up in January.
So… Is Twitter Growing or Just Getting Louder?
Technically, yes. Twitter (X) is growing. But growth isn’t always what we think it is.
Reuters: Growth has been uneven since the takeover, with surges in new signups but also indications that not all the new users will stick around. Some signed up out of curiosity (or chaos), others have already drifted away.
And to be fair, that makes sense. The platform does feel different. It feels faster. More chaotic. Sometimes it feels like everybody in the room is shouting, but nobody is listening. You pop on for five minutes, and an hour later you’re still scrolling, wondering what you’ve actually accomplished.
Where Are the New Twitter Users Actually Coming From?
There’s another side to this story, of course. Geography. Twitter’s growth isn’t uniform, and it never has been.
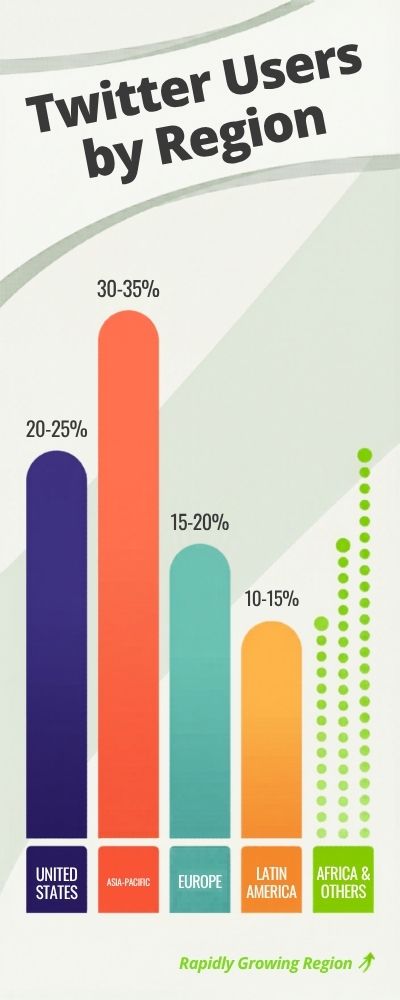
Statista: The United States accounts for around 20 to 25% of Twitter’s user base, but much of the recent growth has been coming from Asia-Pacific, Latin America and other emerging markets.
| Region | Share of Twitter Users |
|---|---|
| United States | ~20–25% |
| Asia-Pacific | ~30–35% |
| Europe | ~15–20% |
| Latin America | ~10–15% |
| Africa & Others | Rapidly growing |
This alters the character of the platform completely. Trends spread differently. Discussions seem more international. Sometimes you’ll see a hashtag trending and have no clue what’s happening, and oddly, that’s fun.
The Bottom Line (If There Even Is One)
How many people are on Twitter (X) in 2025 then?
From the various reports out there, the best guess is somewhere between 400 to 500 million users around the world in 2025, according to DemandSage and Business of Apps. It’s growing, but also uncertain.
Perhaps that’s the real lesson though. Twitter isn’t about the numbers; it’s about influence, culture, noise, and occasionally, utter madness.
It might not be the largest platform out there, but it’s still one of the most discussed. And in an attention economy, that’s worth something.
Monthly Active Users vs Daily Active Users: What Twitter’s Real Engagement Looks Like
![]()
![]()
Twitter, now X, has a somewhat strange tendency to focus on mDAUs (monetizable daily active users) rather than MAUs (monthly active users). You’ve likely noticed it if you tried to compare Twitter to Facebook or Instagram.
According to Twitter Investor Relations, in 2022, Twitter had 237.8 million mDAUs, meaning users who logged in daily and could be shown ads. What about users who log in weekly?
Or just lurk when a trending topic comes up? They’re not counted in that figure. That’s where the distinction between daily and monthly users can be misleading.
But what does this mean exactly?
In simple terms (I promise, no math homework!):
- DAUs (or mDAUs) = the number of people that use Twitter every day
- MAUs = the number of people that use Twitter at least once a month
So where’s the trick? Twitter doesn’t officially report MAUs anymore. That probably has something to do with the fact that DAUs present a more ‘engaged’ image of the platform (i.e. better for advertising).
As per Business of Apps, Twitter had around 450m global monthly active users in recent years, despite a much lower daily active user base.
That difference says a lot. There’s a lot of people on Twitter… but they don’t all use it every day.
A quick snapshot of Twitter engagement (DAUs vs MAUs)
| Metric | Estimated Value (2022–2025) |
|---|---|
| Daily Active Users (mDAUs) | ~238 million |
| Monthly Active Users (MAUs) | ~400–450 million |
| DAU/MAU Ratio | ~50–55% |
Per DemandSage, Twitter’s DAU/MAU is ~50-55%. Interesting right? Half of Twitter’s MAU is a DAU. Is that good or bad? Well, it depends on how you look at it.
Facebook, for instance, has a much higher ratio, often north of 60%. Twitter has historically always been a different type of platform. It’s not a daily scroll fest, it’s a “check what’s happening” kind of platform. Event-Driven.
This is where it gets a bit personal. What’s your Twitter usage pattern like? Do you religiously open Twitter every morning? Or do you hop on when you hear about a breaking news story, or a viral Twitter thread, or some controversy is brewing? See what I did there? Twitter is an event-driven platform.
According to Reuters, user activity tends to spike during major global events: elections, sports finals, celebrity drama, you name it. This is why the MAU is larger. There’s a massive chunk of “casual” users who only use the platform when there is something going on.
They’re not daily active users, but users nonetheless. I quite like this aspect. It doesn’t feel like a daily obligation. It feels like tuning into a live event.
Lurkers vs Creators: The Silent Majority
We don’t talk enough about this. The vast majority of Twitter users don’t tweet. In fact, according to Pew Research Center, a small minority of users account for the vast majority of tweets. Specifically, they found that the top 10% of users accounted for about 80% of the tweets.
Then, what do we mean by “active users”? Someone who tweets 20 times a day? Or someone who sits quietly scrolling through threads at midnight? Both are “active users,” but they represent very different types of engagement.
So… What Does “Real Engagement” Actually Look Like?
If you ignore the numbers for a minute, Twitter’s engagement is a combination of:
- Power users (posting daily, creating, influencing)
- Check-in users (logging in weekly, or for events)
- Lurkers (browsing, reading, but barely engaging)
And this is why the DAU vs MAU thing is a big deal. Focusing on daily users makes Twitter sound smaller than it is. Focusing on monthly users makes Twitter sound more engaged than it is. According to Statista, Twitter’s continued growth in DAU over the years indicates a dedicated core audience, but those MAU numbers reveal a bigger, more occasional audience.
The Bottom Line (And a Slight Reality Check)
If you want to understand Twitter’s real engagement, you have to kind of accept both of these things:
Twitter has hundreds of millions of users around the world…
But only a fraction of those users are on the site every single day
And that’s not really a failing. That’s just… Twitter. Twitter isn’t your local watercooler. It’s more like your favorite coffee shop. You don’t go there every day, but when you do go, it’s for a reason. You don’t want to miss what’s happening. And maybe that’s its superpower.
Twitter Revenue Breakdown (2020 to 2025): Ads, Subscriptions, and New Monetization Models
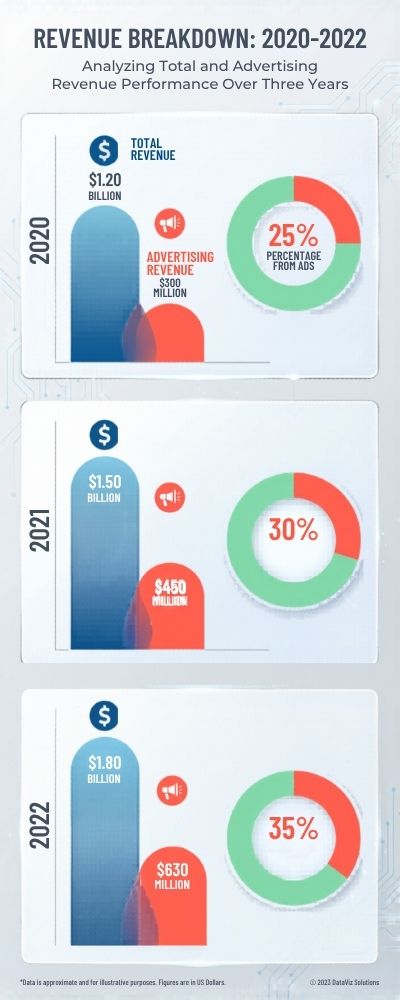
For years, Twitter’s business model was simple, maybe too simple. Ads paid the bills. And not just casually, but overwhelmingly. In 2020, Twitter generated about $3.7 billion in total revenue, with roughly 86% coming from advertising.
According to Statista, that dominance didn’t fade in 2021 either, when ad revenue climbed to around $4.5 billion out of a total $5.08 billion.
Now pause for a second. That’s a heavy reliance on one income stream. It’s like running a restaurant where only one dish sells, and hoping people never get tired of it.
By 2022, things peaked (at least for the pre-acquisition era). According to Twitter Investor Relations, total revenue reached approximately $5.08 billion, with ads still contributing the majority.
Revenue Breakdown (2020 to 2022): The Pre-X Era
| Year | Total Revenue | Advertising Revenue | % from Ads |
|---|---|---|---|
| 2020 | $3.7B | ~$3.2B | ~86% |
| 2021 | $5.08B | ~$4.5B | ~89% |
| 2022 | $5.08B | ~$4.4B | ~87% |
That doesn’t take a genius to see where that is going. Advertising was the lifeblood. It was THE lifeblood.
The Tipping Point
Then in late 2022, Elon Musk assumed control. And “tipping point” might be a euphemism.
Advertisers stopped. Some stopped advertising due to brand safety issues and content moderation policies. Twitter’s ad revenue fell by as much as 50 percent at times after the takeover, according to Reuters.
That isn’t a speed bump. That is a punch to the gut.
And when your main source of income goes on a starvation diet overnight, you don’t wait for the news cycle to shift. You react. You test. You try to find what works.
The Age of Subscriptions: Twitter Blue and Beyond
So subscriptions happened.
Twitter Blue, now part of X’s multiple revenue streams, was introduced. For a monthly fee, users would be verified, have greater reach, see fewer ads, and have other benefits.
According to Business of Apps, though still far behind advertising, revenue from subscriptions has grown since 2022. Hundreds of millions of dollars a year in revenue could be added, though I couldn’t find an exact figure.
This is where we split.
On one hand, it is diversifying revenue. On the other hand, we are talking about asking users to pay for a formerly free service. People will not pay unless they have to.
Revenue Streams in the X Era (2023-2025 Estimates)
| Revenue Source | Estimated Contribution |
|---|---|
| Advertising | ~60–75% (declining share) |
| Subscriptions (Twitter Blue, Premium) | ~10–20% |
| Data Licensing & Other | ~10–15% |
Alright, so ads are still leading the pack…but less so. That pie is getting split up a bit more.
New Monetization Experiments: Throwing Spaghetti at the Wall
This is the part that’s starting to feel like a startup trying to find its way a little bit.
X has launched:
- Creator monetization (ad revenue sharing)
- Paid subscriptions for content creators
- Long-form content features
- Payments and financial services (in development)
Per Reuters, X has been testing out new revenue streams, including payments and more creator features.
Some of these are logical. Some seem a bit… experimental. But that’s basically the strategy.
So, Is Twitter (X) Making More or Less Money?
The somewhat awkward answer is that depends on the time frame.
- Pre-2022: Ad revenue growth
- Post-2022: Ad revenue decline, amid revenue instability, and new tests
- 2024 to 2025: An effort to stabilize the ship, with more diversified revenue
Via Statista, Twitter’s best revenue years were prior to the takeover, while it’s been a little up and down since then.
And to be honest, it does feel like the platform is still in flux. Not in a failing way, but it’s not stable.
The Bigger Picture (And Some Context)
Stepping back, Twitter’s revenue narrative is not about the figures, but about what Twitter is.
Is it an ad platform? A subscription service? A creator economy platform? A payments app of the future?
Right now, it’s trying to be all of those things.
And maybe that’s dangerous. Or maybe it has to be.
Because clearly, relying almost solely on ads wasn’t going to cut it over time. But finding new revenue streams to replace it? That’s the challenge. That’s where things can get ugly.
And as you can tell, if you’ve been paying attention, we’re still in that ugly phase.
How People Use Twitter in 2025: What People Post, What They Read, and Everything in Between

You open Twitter (or X, or whatever you still call it), and you’ll be convinced that everybody is chiming in. Takes are being hot, threads are being stacked, and memes are being mutated all in real time. But the reality is that most people are not saying anything at all.
10% of Twitter users are responsible for 80% of all tweets, according to Pew Research Center. That number might be a few years old, but it doesn’t feel any less true today in 2025. A small vocal minority is doing all the talking, while the rest of us are…well…reading? Liking? Scrolling? The answer to that brings us to our next section.
I can recall weeks where I didn’t tweet once, yet still managed to waste a lot of time “just looking around.” I wasn’t truly inactive. I was just passively engaged.
The Three Types of Twitter Users (Whether You Like It or Not)
So broadly speaking, when you zoom out, you can group Twitter users into three pretty imperfect, partially intersecting buckets:
| User Type | Behavior | Estimated Share |
|---|---|---|
| Creators | Tweet, reply, post threads regularly | ~10–20% |
| Reactors | Like, retweet, occasionally reply | ~30–40% |
| Lurkers | Scroll, read, rarely interact | ~40–60% |
The fun part is, these roles are highly interchangeable. A person could be a “creator” during a major event (frantically tweeting away for their life) and a “lurker” the following week. Twitter isn’t an identity so much as it is a state of mind.
Lurking Isn’t Laziness, It’s the Default
The odd thing is there seems to be an expectation that if you’re not posting, you’re not “actually” using the platform. Except that’s not accurate at all.
Image by Statista A substantial amount of Twitter users use the platform mainly for news consumption and not content creation. They’re not there to participate, but to learn.
Which makes perfect sense, to be honest. Not everyone wants to engage in a public discourse where the comments section can devolve into chaos in a matter of moments. Sometimes you just wanna read, process, give one or two side-eyes and continue on with your day.
Lurking is a severely underrated activity. It’s so much more relaxing.
Posting habits: Less Often, More Calculated
The posting hasn’t completely disappeared; it’s just become more deliberate.
Image by Hootsuite, the average user now tweets less often than they used to in the past, however, more engagement is now focused around high-quality or viral tweets.
In other words? People aren’t dumping their every thought into a tweet as much as they used to (or at least, fewer people are). There’s a degree of selectiveness now.
Threads are longer, posts are more impactful, and there’s often an agenda (whether that be going viral, becoming a brand or just getting attention in general).
And yes, it makes the platform feel different. Less friendly, more performative at times.
How People Consume Content on Twitter in 2025
Twitter is fast. When it comes to speed, Twitter still tops almost any other social media platform. The Reuters Institute Digital News Report found that Twitter is a go-to platform for live updates and real-time news, especially when global events are happening.
In other words, it’s where people go to stay up-to-date in real-time. They don’t just read the tweets. They follow the news as it develops. But that’s not the only way people consume content on Twitter. Here are some of the ways you might be consuming content on Twitter:
- Scrolling in bursts
- Jumping between threads
- Skimming more than reading
- Getting pulled into reply sections (admit it, sometimes by mistake)
It’s not really reading content. It’s scrolling and skimming, jumping and digesting in small chunks. And it works.
Twitter Engagement in 2025
Twitter engagement isn’t steady all day long. There are peaks and dips. According to Sprout Social, the best times to post on Twitter include:
- Morning hours when people are reading the news
- Lunchtime
- Late evenings.
Yes, midnight. There’s just something about scrolling through Twitter at midnight that feels different. Your guard is down. Your thoughts are a little loose. And before you know it, you’re 40 tweets deep into something you didn’t even know you cared about an hour ago. It’s not tidy. It’s human.
The Emotional Side of Twitter Usage
This is one of those things that doesn’t really appear in the statistics, but it should. Twitter is not just for data. Twitter is for feeling connected…or disconnected.
A Pew Research Center study found that social media, including Twitter, influence the way people consume news, feel a sense of community, and manage their stress levels.
On some days, Twitter is a source of comfort. On other days, it feels like too much. And emotional tug-of-war is one of the many reasons that people pivot between active engagement, lurking, and abandoning the platform.
The Bottom Line: It’s Not About Activity, It’s About Presence
Ultimately, attempting to quantify “how people use Twitter” with a single statistic is a little silly. Some people tweet daily. Some people never tweet. Some people only log on for major events. And all of those people are using Twitter.
According to DemandSage, Twitter is gaining more users…but the way those users are engaging with the platform is getting increasingly diverse and specialized. Perhaps that’s the future of Twitter. Not just one style of engagement, but a 100 different styles all at once. In a way, that’s quintessentially Twitter.
Average Twitter Time Spent: Are Users Increasing or Decreasing?
How much time do users spend on Twitter? That should be a simple stat to figure out, shouldn’t it? Well, no. Because when it comes to time spent, there are a lot of factors at play. What kind of mood are you in? What time of day is it? Did you get sucked into an argument at 11pm?
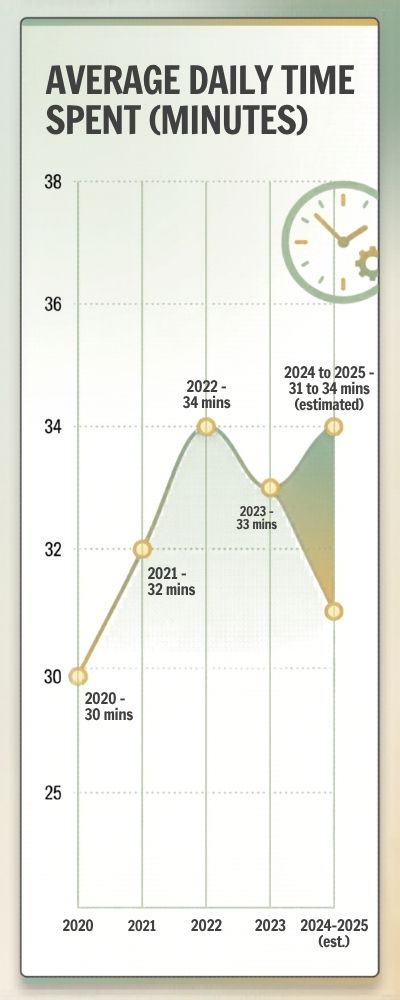
According to Statista, the average amount of time spent on Twitter per day globally is around 30-34 minutes as of the past few years. It’s not blowing up, but it’s not completely dying either. It’s sort of… stable. And in today’s society where attention is constantly being stolen, that’s kind of saying something.
Twitter Average Time Spent Over the Years: Steadily Increasing (Kind Of)
If we take a look at the data from 2020-present, we can see that the time users spend on the app isn’t steadily rising. It’s a bit rocky.
| Year | Avg Daily Time Spent |
|---|---|
| 2020 | ~30 minutes |
| 2021 | ~32 minutes |
| 2022 | ~34 minutes |
| 2023 | ~33 minutes |
| 2024–2025 | ~31–34 minutes (estimated) |
As you might expect, the pandemic increased that time somewhat. We had more time on our hands, more to worry about, and, frankly, more excuses to hit refresh. But after 2022, it has flattened out. It isn’t collapsing or growing. It’s just… consistent.
Engagement vs Addiction: Are We Really “Using” Twitter?
This is where we get a little more abstract. 30 minutes a day doesn’t seem like all that much. But how are we spending that time? According to the Reuters Institute , much of Twitter usage is news-related and real-time information, rather than entertainment.
This suggests most users come to the site with a mission in mind, whether that be to catch up on the news, observe a trend, or follow an event, before leaving again. But come on, we both know that’s the best-case scenario.
In practice, you check one tweet, then another, then before you know it, you’re a dozen tweets deep into a topic you hadn’t even considered five minutes previously. The time we spend on Twitter isn’t always productive, it’s fluid.
Why Time Spent Isn’t Exploding Like Other Platforms
By contrast, other social media platforms are seeing time-spent figures far in excess of Twitter. According to DataReportal, users of platforms like TikTok are often exceeding 90 minutes per day, while Twitter is much closer to 30 minutes. Initially, you might see this as a failing on Twitter’s part, but I’m not so sure.
Twitter isn’t meant to be a platform where you spend hours on end scrolling endlessly. It’s more akin to a news wire, you tune in, get the info you need, then tune out again. At least, that’s the theory. It’s not a binge medium; it’s a medium you dip in and out of.
The Drop-Off Question: Are People Losing Interest?
Now we get to the part that’s a little unclear, and, quite frankly, a little too close to home.
- Per Reuters
- , “While some users have increased their time on the service, others say they are spending less time on Twitter or plan to leave altogether.” 1
You can kind of feel that, can’t you?
Sometimes Twitter is electric; it’s fast, it’s topical, it’s addictive. Sometimes it’s cluttered, repetitive, and exhausting. And all of that impacts session length.
There are some things that just don’t translate to a graph.
What Actually Drives Time Spent?
Ultimately, there are a few big things that effect time spent:
- Breaking news and live events lead to a surge in engagement
- Viral discussions or threads lead to longer sessions
- Algorithm changes can lead to unpredictable time spent
- Mood (I’m serious) has a huge effect
- Per Hootsuite
- , engagement usually peaks during global news events, further supporting the notion that Twitter is event-driven, not habit-driven.
Which is why your time spent may vary drastically from week to week.
So… Are We Spending More Time or Less on Twitter?
The answer is… yes. The relatively consistent average time (~30 to 34 minutes) means that our engagement is strong. The varying nature of our behavior means our behaviors (and expectations) are changing.
According to Statista, we haven’t dramatically reduced the amount of time… nor have we increased it dramatically. And perhaps that is okay.
The Real Takeaway: It’s Not Time… It’s Intensity
Twitter doesn’t need to keep us the longest. Twitter needs to be the place we can’t afford to miss. We don’t spend as much time as other places… but when we are there… it’s intense. Urgent. Overwhelming.
And perhaps that is the trade-off. Less time, more impact. Which depending on the day is either exactly what we need, or exactly what drains us.
Top Twitter Demographics: Age, Gender, Geography, and Income Insights
You see, I think there’s a perception that Twitter is “for everyone.” In a way, that’s right. In another way, not at all. It’s got a very specific user profile, and once you become aware of it, you can’t ignore it.
According to Pew Research Center, Twitter users skew younger, more educated, and more urban than the general population. That’s not representative of society at large.
It’s representative of people who are informed (or over-informed) about the news, pop culture, and, let’s admit it, their own opinions. That’s part of why it feels the way it feels when you scroll through it. It’s not just about the content; it’s about the point of view.
Age Range: Young, but Not Gen Z Young
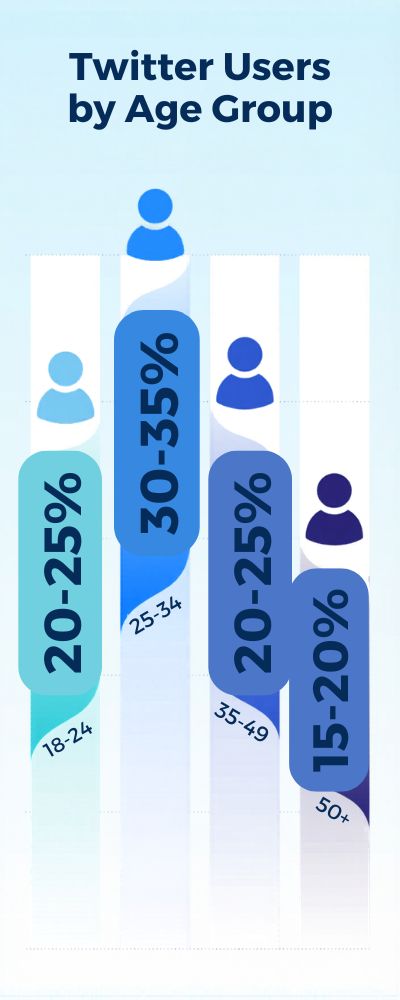
According to Statista , the largest age demographic on Twitter are users from 25-34 years old, followed by users between 18-24 years old.
| Age Group | Share of Twitter Users |
|---|---|
| 18–24 | ~20–25% |
| 25–34 | ~30–35% |
| 35–49 | ~20–25% |
| 50+ | ~15–20% |
What’s interesting here is the balance. Twitter isn’t dominated by teens; it’s more a young professional crowd. People who are working, thinking, reacting to news, building personal brands… or just arguing about things they probably shouldn’t care that much about.
Gender Split: Slightly More Male Than Female
If you’ve ever felt like Twitter conversations skew a certain way, you’re not imagining it. According to DataReportal, Twitter’s global user base is approximately 60 to 65% male and 35 to 40% female.
| Gender | Share of Users |
|---|---|
| Male | ~60–65% |
| Female | ~35–40% |
That skew affects the character of the platform in ways we may not even recognize. It impacts conversations, humor, what gets popular. And although the divide has closed somewhat over the years, it still exists.
Geography: A Truly Global Platform (But Unevenly Distributed)
Twitter can seem very US-centric at times, but the stats tell a different story. Via Statista, the US makes up about 20 to 25% of users, with the remainder dispersed in countries like Japan, India, Brazil, Indonesia and the UK.
| Country/Region | Share of Users |
|---|---|
| United States | ~20–25% |
| Japan | ~10% |
| India | ~8–10% |
| Brazil | ~6–8% |
| Others | Majority combined |
Quite frankly, that’s one of the most underrated aspects of Twitter. You get a global outlook, and it can be enlightening, baffling, or crazy. But mostly, it’s not dull.
Income & Education: A More Affluent, Educated Audience
Now we get into slightly murkier waters.
According to Pew Research Center, Twitter users tend to have higher levels of education and income than other social media users.
- They’re fairly likely to have college degrees
- They tend to be middle-to-high income
- Urban professionals are a large part of the platform
That’s probably why Twitter can often feel like a newsroom, a panel discussion, and a group chat combined.
Sometimes, that makes it enlightening. Sometimes, it makes it a bit tiring.
Demographic Snapshot
| Category | Key Insight |
|---|---|
| Age | Dominated by 25–34 year olds |
| Gender | More male than female users |
| Geography | Global, but US still leads |
| Income | Higher-than-average income levels |
| Education | More likely to be college-educated |
The Human Impact of the Data
There is what the data says, but then there is what the data feels like. The demographics of Twitter affect everything from the speed of the conversations to what gets trended to how people communicate.
It is a place where journalists and developers and marketers and everyone else intersect. And the intersection is a strength. It is also a weakness. Some days it feels like you are learning something new every five minutes. Some days it feels like nobody is listening to each other.
The Bottom Line: Demographics Define the Culture
If you are going to deconstruct Twitter, you have to recognize that the issue is not just a matter of how many people are on Twitter, but who is on Twitter.
According to DataReportal, Twitter’s demographics are shifting, particularly in developing markets, but are generally defined by a young, educated, digitally-enabled crowd. And maybe that is why Twitter matters. Not because it has the biggest crowd, but because of the character of the crowd.
From Twitter to X: Key Platform Changes and Their Impact on Growth
Twitter becoming X wasn’t just a name change; it was like walking into your favourite coffee shop to find someone had come in overnight and moved everything around. Still the same, but still not quite right.
The rebrand happened after Elon Musk took over the platform in late 2022. By mid-2023, the name, the logo, even the little blue bird were all gone. According to Reuters, the intention was to pivot the platform into an “everything app”, more like WeChat than a social media platform.
I think we all know whether people immediately adjusted to this new reality or not.
Key Platform Changes: What Actually Happened?
The changes went far beyond a simple rebrand, as almost every aspect of the platform was impacted.
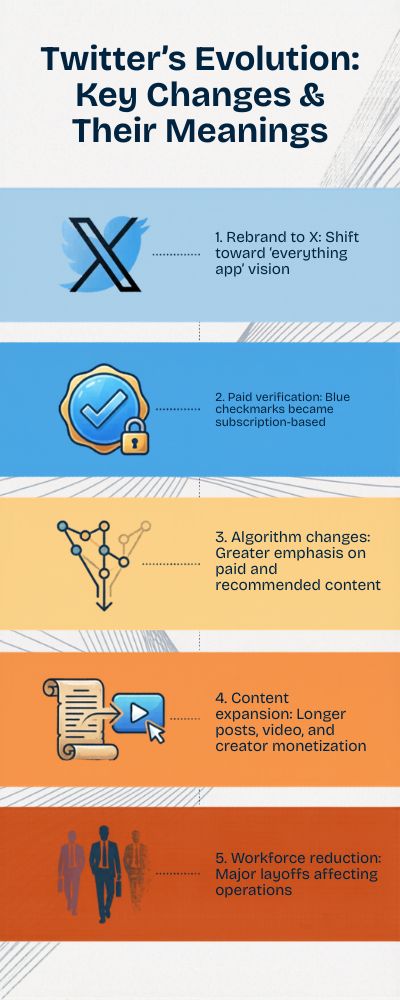
| Change | What It Meant |
|---|---|
| Rebrand to X | Shift toward “everything app” vision |
| Paid verification | Blue checkmarks became subscription-based |
| Algorithm changes | Greater emphasis on paid and recommended content |
| Content expansion | Longer posts, video, and creator monetization |
| Workforce reduction | Major layoffs affecting operations |
Each of these things might not have been a big deal on its own. Together? It was a form of identity change that had to be digested in real-time. And you know what? People often hate change. Particularly on platforms they use every day.
User Growth: A Mixed Bag of Gains and Losses
So what’s happened to growth? Well… According to DemandSage, Twitter (X) still has hundreds of millions of users across the world, and was growing towards 400 to 450M users. That’s a good thing, right? Except…
According to Reuters, the growth has been patchy. Bumps in new signups, matched with drops in engagement & retention in some markets. Thing is, change gets your attention. But doesn’t always keep your attention.
Engagement Shifts: More Noise, Less Stability?
Perhaps the most obvious change is in engagement patterns. According to Statista, the steady increase in daily active users on Twitter slowed down after 2022, due to changes in the way the platform now functions, and the types of content it now favors. It now favors:
- Recommended content
- Viral content
- Paid content
Depending on who you ask, that’s either a great thing, or a bit much. For me? I think the timeline just got noisier. Faster. A little more difficult to read. You see more. Just not always what you want to see.
Ad Revenue Impact
We know Musk made big changes to the platform, but how did the advertisers react to the purchase? What did advertisers think of the idea of a “free speech absolutist” owning the platform?
According to Reuters, in some months ad revenue was down nearly 50% compared to before Musk took over. Now that is a big deal. This is also why they started to emphasize things like:
- Subscriptions
- Creator monetization
- New revenue streams
It’s hard to wait and see what happens when your bread and butter takes a 50% hit.
The Everything App Goal
This part is a little more speculative, but interesting nonetheless. What is the end goal here? Per The Verge, it is to be an “everything app”.
- Payments
- Long form content
- Creator monetization (ecommerce)
- Banking?
And they are still in the middle of testing different features and rolling them out slowly. Now, I am not going to sit here and tell you it’s impossible to build an everything app, but it is not easy. You need to establish trust. Consistency. Simple user interface. None of which the app currently has.
The Non-Quantitative Effects
The other thing that won’t be highlighted in any graph.
The platform is still growing in users. As per Business of Apps, X is still among the most popular social media platforms worldwide.
However, growth is not only about volume. It’s also about identity.
Some people like the changes. They see progress. New things. A platform developing.
Others feel that it’s lost something along the way. A sense of familiarity. Perhaps even trust.
Both feelings are valid.
The Bottom Line: Still Changing, Still Unstable
The transformation of Twitter to X has no clear ending date.
- User base: Still growing, just not as consistently
- User engagement: Much more unpredictable
- Monetization strategy: Still changing very rapidly
- Platform personality: Still developing
As per DemandSage and Reuters, the platform is still in flux.
Perhaps that’s the best way to sum it up.
It’s not the same Twitter people signed up for years ago. But it’s not something entirely new yet either.
It’s in the middle. And whether that’s a good thing or a bad thing depends on how much you enjoyed the previous iteration.
The Rise of Paid Features: Twitter Blue, Subscriptions, and Creator Monetization Stats
You could sign up, tweet, argue with strangers, and… well, that was basically it. No credit card needed. But then things started to change. At first, slowly, and then all at once. Since Elon Musk took over, the platform has been making paid features a priority.
Not just “this is a thing on the side,” but more of a “this is the future” type of situation. Twitter launched its paid verification service Twitter Blue shortly after Musk’s acquisition, Reuters reported, which allowed users to pay for check marks instead of earning them.
That was a big change, and not everyone was happy. This wasn’t just about paying for features, it was about paying for identity, for visibility, and, in some cases, credibility.
Twitter Blue: What do users pay for?
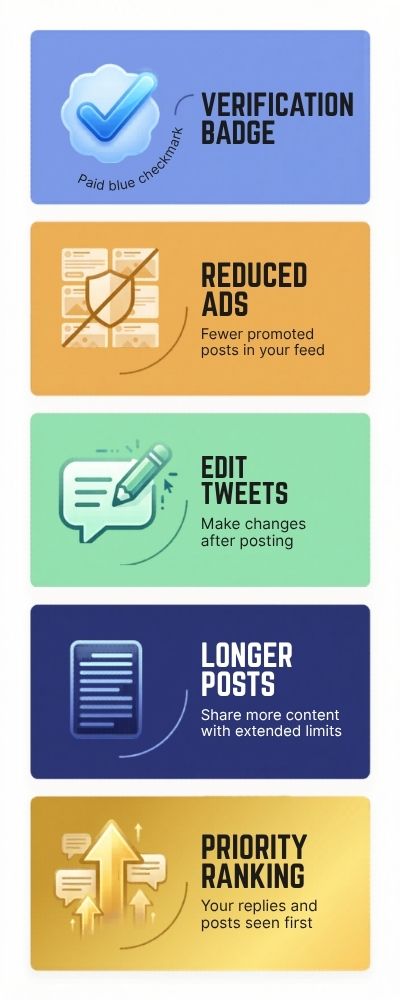
Twitter Blue (which is often now just called X Premium) isn’t just about the blue check mark. It’s a collection of features targeted at power users and creators.
| Feature | What It Offers |
|---|---|
| Verification badge | Paid blue checkmark |
| Reduced ads | Fewer promoted posts |
| Edit tweets | Post-editing capability |
| Longer posts | Extended character limits |
| Priority ranking | Higher visibility in replies |
The million-dollar question: are they actually paying for it?
Business of Apps reported that Twitter Blue adoption has been relatively low compared to total users, with only a small percentage subscribing globally. Okay, no big surprise. Getting millions of users to pay for something they used to get for free is never an easy sell.
But although the numbers are small, Twitter is earning more from subscriptions than ever. DemandSage estimates that Twitter now earns hundreds of millions in annual subscription revenue, though that still trails their advertising revenues.
| Revenue Stream | Estimated Share (2024–2025) |
|---|---|
| Advertising | ~60–75% |
| Subscriptions | ~10–20% |
| Other (data, licensing) | ~10–15% |
Alright so we still have a long way to go with subscriptions, but they’re not trivial anymore.
That’s the important bit. It’s not about supplanting ads, it’s about finding a second way to stand.
Creator Monetization: Paying the People Who Post
This should’ve happened a long time ago.
Content Creators have been driving engagement on Twitter for years. But they’ve been compensated little for their efforts. Now that’s finally starting to change.
X has introduced:
- Ad revenue sharing for content creators
- Paid subscriptions (fans pay creators directly)
- Tipping and donations
From Reuters: the platform started sharing ad revenue with content creators, enabling some users to earn money directly from their tweets.
Honestly, that matters.
Because now, for the first time, posting isn’t just about getting attention, it can be about making money.
Creator Earnings: Hype vs Reality
Ok before everyone puts in their notices and starts to work on that tweeter career full time. Let’s get some perspective
From The Verge: Initially at least, some creators were raking in thousands of dollars while others were making next to nothing.
That distinction is key.
It’s not an even playing field. Earnings will be skewed based on things like:
- Follower count
- Engagement
- Content reach
- Algorithm visibility
So while there is money to be made, it won’t be spread equally. More like a winner takes most system.
User Behavior: Are People Willing to Pay?
This gets a little… human. Source: Statista
Awareness of Twitter Blue is decent, but subscribers are scarce. This could be due to:
- Price sensitivity
- Unclear value
- Habit (people are used to free platforms)
Frankly, I understand. No one thinks, “What I need today is a paid social media subscription.” But some people do, particularly creators, professionals, and power users.
The Even Bigger Picture: Platform -> Ecosystem
Stepping back even further, none of this is really about Twitter Blue or even subscriptions.
This is about making X an ecosystem where value flows in all directions:
- Users pay for products
- Content creators get paid
- Brands pay for ads
Per Reuters, the company is “also still testing other ways to generate revenue, such as payments and additional tools for content creators.”
This is messy. It’s moving. It’s clearly deliberate.
The Bottom Line: Paid Features Are Here to Stay
Twitter (X) is no longer a free platform, and it’s not going back.
- Subscriptions are growing, but still niche
- Creator monetization is promising, but uneven
- User adoption is cautious, not enthusiastic
Per DemandSage and Business of Apps, paid features are playing an increasingly important role in the platform’s roadmap, even if it isn’t the only story.
Perhaps that’s the real story.
People will pay, but only if they think it’s worth it.
And currently? That’s still being written on the fly.
Algorithm vs Chronological Feed: What Drives Visibility on Twitter Today?
If you’re an experienced Twitter user, you’ll recall that the Twitter timeline used to be purely chronological. Whoever posted most recently appeared at the top, and whoever you followed was what you saw in your timeline. Simple enough, right?
That’s not the case anymore.
As explained on the Twitter Engineering Blog, Twitter began incorporating a relevance model in order to display the most relevant content rather than simply the most recent. In essence, they wanted to surface the tweets that you are most likely to engage with rather than the absolute latest.
That seems like a nice gesture, but is it a positive or a negative?
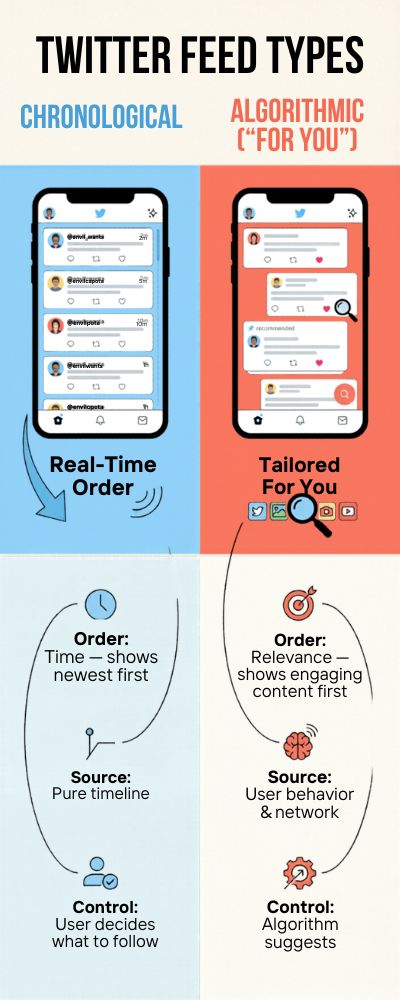
| Feed Type | How It Works |
|---|---|
| Chronological | Shows tweets in real-time order |
| Algorithmic (“For You”) | Shows tweets based on relevance, engagement, and behavior |
According to Twitter Engineering Blog, X (formerly Twitter) now offers both, but let’s be real, the algorithmic “For You” timeline is the one you see first. It’s the default. Defaults have more impact than you might suspect.
What the Algorithm Actually Optimizes For
So how do you get your tweet in front of people’s eyeballs? As Twitter itself describes in their open-source recommendation system, the algorithm considers factors such as:
- The likes and retweets you receive on a tweet
- How many replies and depth of a conversation you’re a part of
- Your past interactions with an account
- How engaging and recent the content is
It even surfaces tweets from accounts you don’t follow if the algorithm thinks you’ll be interested. Which is both amazing… and a little creepy. Engagement trumps timing: The impact of engagement on visibility (vs timing)
| Factor | Impact on Visibility |
|---|---|
| Engagement (likes, replies) | Very high |
| Follower count | Moderate |
| Recency | Moderate |
| Content relevance | High |
This is the turning point. The algorithm isn’t all about posting at the “right time” anymore. It’s about receiving engagement quickly. And yeah, that definitely influences behavior. It’s no longer about writing tweets to communicate a message. It’s about writing tweets to generate engagement.
The Chronological Feed: Still There, But Less Powerful
You can still opt-in to a chronological feed (“Following” tab). It does just what it says on the tin. It shows you tweets, in order. But this is the caveat.
According to Hootsuite, users tend to focus more on the algorithmic feed because it delivers more engaging content, even if it’s not from people they follow.
So, while the chronological feed still exists. It’s not really the one that matters. It’s a preference thing, not a visibility thing. And if you’re looking to boost your reach? The algorithm is the name of the game.
Paid Boost Factor (Yes, This Exists)
Alright, this one’s a bit contentious.
Ever since the paid features were introduced, paid users (think X Premium) may be seeing their replies and conversations ranked higher.
The Verge: paid users might see some priority ranking that affects their reach.
Whether or not you believe this is “right” or “wrong”, that’s a different story.
But it affects the visibility of posts.
User Experience of the Algorithm (Not a Metric, But Real)
This is where the metrics hit home.
The algorithm can feel like it “understands” you at times, showing you posts you actually want to see.
And at times it can feel like it’s just pushing popular posts into your face to distract you.
And if you’ve ever made a post that you thought was amazing… only to find that nobody looked at it… well you’ve just felt algorithm.
It’s not always consistent. It’s not always fair. But it works.
So… What Matters for Visibility These Days?
- Engagement matters most
- Relevance > recency
- Algorithmic > chronological delivery
- It’s a pay-to-play game too
Via Twitter Engineering Blog and Hootsuite , Twitter surfaces tweets that encourage engagement:
“Rather than simply sorting all the tweets you see right now by the time they were posted, we’re now sorting so that the best and freshest tweets you’re likely to care about appear first, in reverse chronological order.”
Did you catch that last part? That’s the big change.
The Bottom Line: It’s a Battle for Attention
Twitter’s no longer a timeline. It’s a battle for attention.
The timeline tells you what happened. The algorithm tells you what you care about.
Most of the time, the algorithm wins.
Is that a good thing? I dunno. Some days I think so. Other days I don’t feel like I have a choice.
What I do know is this, if you want to get seen on Twitter these days, you’re not just posting to a timeline.
You’re playing an algorithm game.
Twitter vs Other Social Platforms: Market Share and Competitive Position (2020-2025)

Twitter Was Never the Biggest, But It Was Always the Loudest. Size was never really Twitter’s thing. Influence? That’s a different story. In 2020, Twitter had about 192 million monetizable daily active users.
By 2022, that number climbed to 237.8 million. That’s steady growth, but not enough to put Twitter on the same playing field as Facebook or YouTube, which both hit the billions in 2020.
So from the outset, Twitter wasn’t competing on size. It was competing on influence. And to be honest, that’s a much harder thing to measure but a much more interesting thing to track.
The Social Media Hierarchy by 2025
Fast forward to 2025 and the chasm between platforms only grew.
| Platform | Estimated Users / Reach (2025) |
|---|---|
| ~2.2–2.9 billion | |
| YouTube | ~2.5+ billion |
| ~1.6–2 billion | |
| TikTok | ~1.5+ billion |
| X (Twitter) | ~400–500 million |
While Twitter (X) is within the top 10 most popular social media platforms in the world according to DataReportal and Business of Apps , it sits comfortably in the top 10 social platforms globally, but not in the top tier when it comes to user volume. It’s like being a successful indie band. You’re popular, but not THAT popular.
Market Share: A Small Part of a Bigger Pie
When it comes to market share, Twitter (X) doesn’t own a huge part of the social media pie worldwide. Source: Statista Facebook, Instagram, and TikTok have a significant share of users compared to Twitter (X).
However, it seems like Twitter (X) has more visibility per user. That’s because journalists, politicians, business leaders, and content creators are over-represented on Twitter (X) compared to other social media platforms.
In fact, the Pew Research Center found that Twitter (X) users are more likely to follow the news and discuss politics compared to other social media platforms.
So even though it doesn’t have as many users as other social media platforms, they have an oversized influence on the conversations that are happening in the mainstream media. And you can’t really measure that with a chart.
Engagement vs Scale: A Tale of Two Platforms
Here’s where things get really interesting, and actually kind of backwards. While TikTok and Instagram are killing the game when it comes to time spent and entertainment, Twitter (X) is still the go-to platform when it comes to what’s happening right now in the world.
DataReportal en something happens in the world, people still go to Twitter (X). They’re not really “hanging out” as much as they are “checking in.” And maybe that’s why Twitter (X) hasn’t had to be the biggest social media platform in order to remain relevant.
The Rise of Direct Competitors: Threads and Beyond
Fast forward to the release of Meta Platforms’ Threads.
From Reuters: “Threads, the Instagram app that competes with Twitter, has gained more than 100 million users in the four days since its release, the app’s boss said on Wednesday.”
In the months following, hundreds of millions of users continued to flock to the platform.
This doesn’t exactly spell doom for Twitter. But it does complicate the picture.
After all, if users can go elsewhere, what’s keeping them on Twitter?
Revenue Comparison: Following the Money
User numbers aren’t the only metric.
According to Statista, at its height, Twitter made around $5 billion in revenue per year. That’s almost entirely from advertising. Meta and Google rake in tens of billions in ad revenue per year.
| Company | Annual Ad Revenue (Approx.) |
|---|---|
| Meta (Facebook/Instagram) | $100B+ |
| Google (YouTube) | $30B+ (YouTube ads) |
| TikTok | $15B+ |
| X (Twitter) | ~$2–5B |
So Where Does Twitter Actually Stand?
At this point, data isn’t enough.
Twitter isn’t the largest, the fastest-growing, or the most profitable social media platform. But it still has a special role.
It’s where:
- News breaks first
- Trends start (or at least, feel like they start)
- Public conversations happen in real time
As DataReportal reports, social media is increasingly fragmented, with social media users splitting their time between multiple platforms. And in that fragmented social media landscape, Twitter doesn’t need to be the largest platform; it just needs to stay relevant.
The Bottom Line: A Specialist, Not a Giant
Between 2020 and 2025, Twitter (X) didn’t play the scale game. It didn’t suddenly surpass Facebook or TikTok. But it didn’t get wiped out either.
It established itself as a high-impact, real-time discussion platform.
And maybe that’s the real lesson.
Not every social media platform needs to be the biggest to count. Some social media platforms just need to be the first place where things happen, even if the audience is smaller.
The Most Popular Brands and Influencers on Twitter: Which Ones Get the Most Engagement?

Having a big following is great, but that’s no guarantee of engagement. We’ve all seen accounts with millions of followers get almost no response, and then another account posts a single tweet and suddenly everyone on the internet is talking about it. Source: Statista
Accounts like @elonmusk, @BarackObama, and @Cristiano all typically sit at the top of the most followed list. But, as we all know, engagement is not just about how many people you reach, it’s about how they respond.
And that’s where things get a little more complicated. Because let’s be real, we don’t engage with accounts just because they’re popular, we engage with them because they’re interesting, unpredictable, or just a little bit dramatic enough to keep us coming back for more.
Top Influencers by Followers (2025)
| Account | Followers (Approx.) |
|---|---|
| Elon Musk | 180M+ |
| Barack Obama | 130M+ |
| Cristiano Ronaldo | 110M+ |
| Justin Bieber | 110M+ |
| Rihanna | 100M+ |
Statista reports that they hold the top positions in terms of number of followers. However, we have established that having a large number of followers is not the same as having engagement. Some of these accounts don’t even tweet that much.
Others (I’m looking at you, Elon) tweet all the time and encourage ongoing engagement. When it comes to engagement, personality trumps popularity. This isn’t always reflected in a top 10 list. Basically, accounts that seem more human engage more.
Whether that is through humor, controversy, or any other persona trait, if you can connect with people, you’ll have better engagement. Hootsuite found that the most engaging types of tweets are those that ask questions, state opinions, and make controversial statements.
This is why some influencers thrive on Twitter:
- They tweet a lot
- They engage with others
- They are unpredictable
- And, yes, sometimes they over-share, but that’s the idea.
Brands that succeed on Twitter
On the flip side, brands don’t do so well. Most come across as, well, brands. There are a few exceptions, though.
| Brand | Engagement Style |
|---|---|
| Wendy’s | Humor, sarcasm, roasting |
| Netflix | Pop culture, memes |
| Nike | Inspirational storytelling |
| Starbucks | Community-driven content |
Brands that use a unique voice and conversational tone tend to have higher engagement rates than brands that sound like, well, brands, according to Sprout Social.
Honestly, you can kind of tell. Some tweets sound like advertisements. Others sound like they were written by an actual internet user. Not the same.
Engagement Rates: Small Accounts Can Win Big
This is where things get surprising. Smaller accounts tend to have higher engagement rates than big ones, even if their overall engagement is lower, per Rival IQ.
| Account Size | Avg Engagement Rate |
|---|---|
| Small (<50K followers) | Higher engagement % |
| Medium (50K–1M) | Moderate |
| Large (1M+) | Lower % but higher volume |
Does that make sense? Smaller accounts feel human. They are more likely to respond, engage and care. Larger accounts can feel like radio stations at times.
What Actually Drives Engagement in 2025?
If you really distill it, there are some obvious patterns:
- Authenticity over production consistency
- Quantity is important but quality is more important
- Controversy and emotion drives engagement
- Comments are as important as Tweets
As DataReportal explains, “The growing importance of interactive formats is playing a key role in shaping this year’s social media behaviors, with people spending more time engaging with others’ content, rather than simply consuming it.” And Twitter, perhaps more so than any other platform, is all about engagement.
The Emotional Element of Influence
Ok, this one is much harder to quantify but hear me out. People don’t just consume what you create, they judge you for it. They disagree. They argue. They fight. They support you too. But the point is, engagement on Twitter can be emotional.
As Pew Research Center points out, Twitter users are more likely to discuss news and social issues which are inherently emotional. And yes, this makes the platform appear toxic at times. But it also makes it feel…human.
The Bottom Line: Influence Is Earned, Not Given
So, who actually drives the most engagement on Twitter? It’s not necessarily the accounts with the most followers. But rather, accounts that:
- Feel human
- Initiate conversations
- Take risks
- Are consistent
As Hootsuite and Rival IQ report, engagement is not just about reach, it is about resonance. And if there is one thing that Twitter has taught us over the years, it is this: People don’t engage with accounts. They engage with voices.
The Future of Twitter (X): Users, Revenue, and Platform Trends Predictions (2030)
Predicting what will happen to Twitter is a lot like predicting the weather somewhere that goes through four seasons in one day. It’s possible to make an educated guess, but surprises lurk around every corner.
That said, we do have some direction. Assuming Twitter continues on the path it’s on, here’s what the future of Twitter’s user base and revenue might look like.
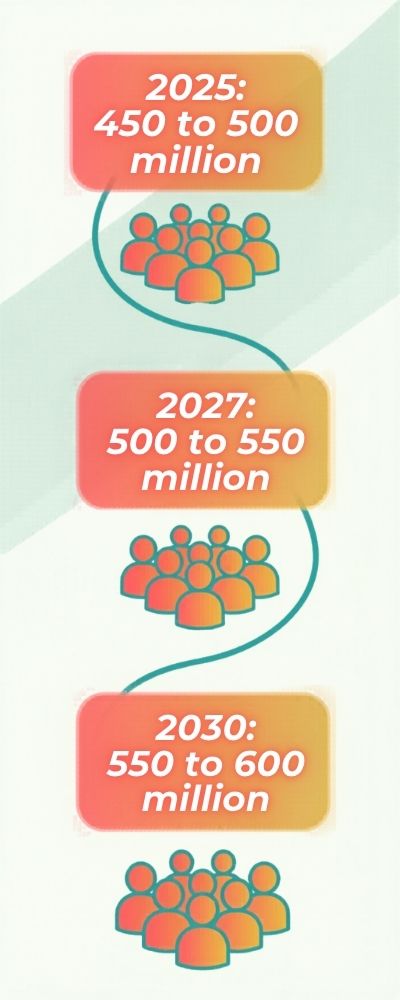
Twitter is expected to see steady growth, even if it isn’t explosive growth. By 2025, Twitter is projected to hit 450 to 500 million users, with continued moderate growth until 2030.
That’s nothing compared to the growth rate of, say, TikTok or Instagram, but it does show that the platform is expected to keep moving forward. And at this point, maybe that’s all we can ask for.
| Year | Projected Users |
|---|---|
| 2025 | ~450–500 million |
| 2027 | ~500–550 million |
| 2030 | ~550–600 million |
Per Business of Apps and DemandSage, this growth will come mainly from Asia, Latin America, and some African countries:
These numbers make sense. In established markets, there isn’t much growth left. But on a global level, there still is.
Revenue: Beyond Ad Revenue (Finally)
Historically, Twitter has relied on ad revenue. That is slowly changing. It needed to.
Per Statista, Twitter hit a peak of over $5 billion in revenue, nearly all of it from ad sales. With all of the recent drama, it needs to find other ways to generate revenue.
This is what is expected:
| Revenue Stream | 2030 Projection |
|---|---|
| Advertising | ~50–60% |
| Subscriptions | ~20–30% |
| Creator monetization & other | ~15–25% |
Subscriptions, creator payments, and maybe even financial services might become a larger part of the mix. Whether users completely buy into that idea… well, that’s still to be determined.
The “Everything App” Vision: Realistic or Ambitious?
Now we’re getting into some speculation, but also kinda fun stuff.
Elon Musk has talked a number of times about transforming X into an “everything app” that rolls social media, payments, content and other things into one.
Via Reuters: “X has begun testing payments and the ability of creators to make money on the platform, as well as longer-form content, according to the sources.”
Will it actually become the Western WeChat? Who knows.
It’s a big dream. Maybe too big of a dream. But hey, most of the big platforms started out as something else before growing into what they are today.
Content Trends: More Video, More Creators, More Noise
If you look at where social media in general is trending, there are a few directions things seem to be moving, and Twitter isn’t exempt from that.
According to DataReportal: “Most social media platforms are shifting their focus towards: 1. Video content. 2. Monetization tools for creators. 3. Algorithmic ‘discovery’ features.”
X is already shifting in that direction with longer-form posts, video uploads and revenue sharing for creators.
But here’s the thing: It’s playing catch-up with platforms built from the ground up for those things. So it’s not just a matter of embracing these trends, but embracing them in a way that still feels like Twitter.
Tough!
Competition: The Pressure Isn’t Going Away
Fast forward to 2030. The competition isn’t going anywhere. As Reuters reports, apps like Threads are coming straight for Twitter’s bread and butter, public, text-based discussion.
Meanwhile, TikTok, Instagram, and YouTube will continue to soak up eyeballs and ad dollars. So the future of X isn’t just about growing. It’s about differentiating. What makes you open it over everything else? Now that’s the question.
The Emotional Reality: Why People Might Stay (or Leave)
This isn’t something you’ll find in any projections, but it’s important. People don’t just stick around for the features. They stick around for the habit, the community, or sometimes just the emotional value.
According to Pew Research Center, how people consume news, connect with others, and even see themselves is linked to their social media use.
Twitter has always had that emotional appeal, it’s fast, it’s raw, it’s sometimes too much, but it’s rarely dull. As long as that essence survives, it will have a future. But if it doesn’t…
The Bottom Line: Uncertain, But Far From Irrelevant
Alright, so where does all of this leave Twitter (X) in 2030?
- User growth: modest, not meteoric
- Revenue: more varied
- Competition: brutal
- Identity: still figuring it out
As DemandSage, Business of Apps, and DataReportal all note, X probably isn’t going to become the largest social media platform. But it doesn’t have to be. And maybe that’s the whole idea.
Twitter has always been a little chaotic, a little unpolished, and yet still totally necessary. I just don’t see that changing. In fact, I think that’s how it’s going to survive in the first place.
How Many Tweets Are Sent Per Day? Platform Activity at Scale
Hundreds of millions of tweets are generated every single day, with this including new tweets, comments, retweets, and quote tweets. This makes it one of the most fast-paced social networks around. It also means there’s a lot of competition.
Posting Frequency: How Often Do Users Actually Tweet?
A large majority of users don’t post that frequently, and a tiny minority are responsible for most of the content on the platform. Many users only post a few times per month, but others (like businesses and influencers) post every day, or multiple times per day.
Engagement Rate Per Tweet: What Counts as “Good” Performance?
The average engagement rate per tweet is quite low compared to other social networks like Instagram. However, some tweets can get huge engagement spikes (in the form of likes, comments, and retweets). The engagement rate varies wildly depending on the type of content and the number of followers the account has. Consistency and timing are key.
Likes, Retweets, or Replies: Which Interaction Matters Most?
A reply is generally a better sign of engagement than a like or retweet. Retweets are good for reach, and likes are good for (weak) approval. But replies are conversations, and this is what the platform is all about.
Hashtag Usage Trends: Do Hashtags Still Drive Reach?
Hashtags are still useful for categorising content and for getting involved in conversations. However, they’re not as good at increasing your reach as they used to be. This is because most users now discover content through algorithms rather than searching for/using hashtags.
Trending Topics: How Fast Do Trends Rise and Fall?
Because the platform is so fast-paced, trending topics can grow and die within a matter of hours. This is driven by news, memes, and virality. It’s great for timely engagement, but not so great for longevity.
The Role of Threads: Long-Form Content on a Short-Form Platform
The platform’s character limit is very low, but this constraint can actually be a benefit. That’s why the “thread” was invented, a way for users to post longer-form ideas. They’re commonly used for stories, explanations and commentary. Threads done well can get more engagement than regular posts.
Video Content Performance: Are Tweets Becoming More Visual?
Tweets that contain videos generally get more engagement than those that contain just text. This includes short clips, meme videos and live streaming. Visual content really helps your message stand out in busy timelines.
Image vs Text Posts: What Gets More Engagement?
As with videos, posts with images get more engagement than posts with just text. This is because they stand out more in a busy timeline. Infographics and memes are particularly effective.
Link Click Behavior: Do Users Actually Leave the Platform?
Despite their widespread use, tweets that contain external links often get less engagement than native content. This is because users generally prefer to stay within the platform. This has implications if you’re trying to drive traffic from the platform. Make sure you optimise your headlines and link previews.
Growth of Private Conversations: DMs vs Public Tweets
Many users treat their direct messages (DMs) like email or SMS. This means the platform is increasingly moving towards private messaging, and less-so towards public posting.
Direct Messages (DMs)
Are people using DMs more often? Yes, more and more conversations are happening privately. This is a trend across social media platforms and is also a reason why engagement numbers appear lower.
Verified Accounts and Visibility
Does being verified help you? Maybe. I think verified accounts are given preferential treatment in the algorithm after some of the changes that have happened recently. But it depends on your content and your audience. What it means to be verified has shifted over time.
Bots and Fake Accounts
How many accounts are bots or fake? There are different reports about this, but estimates suggest a noticeable percentage of accounts may not be authentic. This undermines trust in the platform, engagement numbers, and even advertisers’ confidence in the platform. The platform is always working on cutting down the number of bots.
Political and News Content
Is Twitter still for news and politics? Yes! The platform is still huge for news and politics. Many journalists, politicians, and news outlets use the platform to share updates. Breaking news drives a ton of engagement and reinforces the notion that it’s a “digital town square.”
Brand Response Time
How long should a brand take to respond? People expect brands to respond within a few hours. If you respond quickly, it reflects well on your brand. This is why the platform is often used as a customer service tool.
Customer Service
Will brands respond to me if I complain? Yes, many people complain to brands publicly and get responses. Publicly complaining pressures a brand to respond more quickly. This also affects a brand’s reputation and is a part of many customer experience strategies.
Influencer Marketing
Can I monetize my following? Yes, many creators use the platform for brand partnerships and promotions. They’re able to monetize their followings and create sponsored content around tweets. Engagement matters here as does the makeup of your audience. This is also how the creator economy is developing on the platform.
Ad Formats Performance
Do promoted tweets work? Promoted tweets are pretty unobtrusive. They perform well if you have a compelling message and if you target correctly. Native ads tend to perform better than highly promotional ads. Advertisers work hard to make their ads seem authentic and valuable.
Cost Per Engagement (CPE)
What will I pay for an ad campaign? The cost per engagement varies depending on who you are targeting and what industry you are in. Compared to other platforms it can be relatively affordable. Engagement helps. But measuring return on investment is key for advertisers.
Global Reach vs Local Influence
Where is Twitter most used? The platform is most used in countries like the U.S., Japan, and some European countries. People use it in different ways depending on where they are in the world. In some places it’s a news source. In other places it’s much less mainstream.
User Retention Trends
Are users leaving Twitter? User retention rates have bounced up and down since 2020 and through 2025. Some users have stopped using the platform as much. Others still use it quite a bit. The company is working on new features and revenue models to try to retain users. The success of the platform depends on the longevity of its users.
Conclusion
If you take a look at Twitter’s history from 2020 through to 2025, you’ll see that this isn’t a company that operates in straight lines. It grew, but it wasn’t smooth. It generated revenue, but not in a straight line either.
It evolved, but at times, too quickly for many users’ liking. The shift to X, the shift towards subscription revenue, algorithmic timeline, the arrival of Threads… all of these point to a platform still trying to find its way.
According to Business of Apps, DemandSage, and Reuters, in the years to come, Twitter will be less about trying to be the biggest, and more about trying to stay relevant in an increasingly crowded, and increasingly fast-paced social media landscape.
And you know what?
That might be enough. Because through all of this, through the ups and downs, the controversy and the chaos, the users have remained.
Not necessarily for the same reasons, not necessarily for the same purpose, but they’ve remained nonetheless. And as long as that’s the case, Twitter (or X, I guess I should say) will be around for a long time yet.


