It’s 2025, and Instagram still looks a lot like…Instagram. Except when it doesn’t. You load up the app to kill a few minutes, and the next thing you know you’re deep in the weeds of Reels, responding to a Story, and making an impulse purchase.
Table of Contents
It’s not just social media; it’s entertainment, messaging, and shopping, all wrapped up into one. Instagram’s global user base now exceeds 2.4 billion people, which means that even the smallest shifts in how we use the app have the potential to make waves throughout the digital economy, not to mention the ways in which we live our daily lives.
But as I always say, there’s more to the story than just the numbers. It’s the behaviors and preferences that lie behind those numbers that are really worth paying attention to.
So, which direction is Instagram heading in 2025? In this post, we’ll explore the latest Instagram statistics, from user growth and engagement, to revenue, demographics, and beyond. Some of the findings won’t surprise you. Others might.
How Many People Use Instagram in 2025? (Total, Daily Active and Where They Are Located)
Global Instagram users in 2025
Instagram growth is not what it used to be. It’s not an outright decline in new sign-ups, though. It’s more of a slowing pace as if the app is a runner learning to pace itself for the long run. As of January 2025, there are over 2.4 Billion global Instagram users, according to data shared and estimated by Meta Platforms in its latest investor report (view the report on investor.fb.com).
Interesting: The app is not growing as much in the US, UK, Western Europe, and other developed markets. Internet penetration and adoption rates are high in these regions, and almost everyone who wants an account has already created one.
Instead, countries in South East Asia, Latin America and Africa (where internet adoption rates are still growing and more young people are getting online) are accounting for most of the new users, according to recent research on datareportal.com.
This is important: New users equal new audience demographics. You may find that you have more active followers in Jakarta than you do in LA. It wasn’t like this a few years ago and still manages to surprise people.
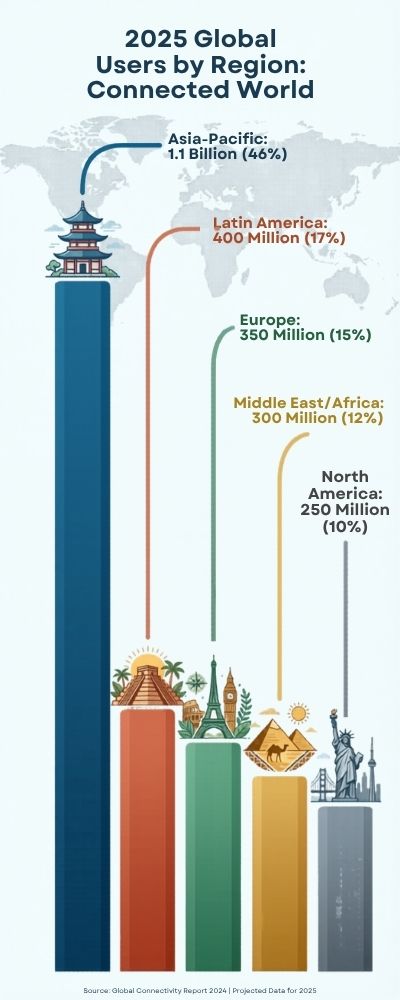
Number of monthly active Instagram users in 2025
| Region | Estimated Users (2025) | Share of Global Users |
|---|---|---|
| Asia-Pacific | 1.1 Billion | ~46% |
| Europe | 350 Million | ~15% |
| North America | 250 Million | ~10% |
| Latin America | 400 Million | ~17% |
| Middle East/Africa | 300 Million | ~12% |
The Time Spent Browsing Instagram Report
The one that hits a little too close to home. Getting users to sign up for Instagram is one thing. But getting them to open the app out of habit? That’s another story altogether.
Instagram’s daily active users (DAUs) are estimated at 1.4 to 1.6 billion in 2025 calculated through aggregated industry data on platforms like Statista and Datareportal. That means more than half of all users check in every single day.
Yes, daily. The average daily user will open the app between 6 to 8 times per day as per Data.ai. If you think that number is too high, just stop for a second and consider how many times you opened the app today. Once in the morning. Once at lunch. Once before bed. Once when you saw a funny Reel. Once when… you get the point.
However, posting frequency is down. Users aren’t creating as much as they used to. They’re browsing. Watching Reels. Swiping through Stories. Lurking more than posting. The mantra is no longer “check out my life”. It’s more “check out what’s going on.” A subtle difference, but an important one.
Average Daily Time Spent on Instagram (2025)
| Metric | Value (2025) |
|---|---|
| Avg. Daily Time Spent | 30–35 minutes |
| Avg. Sessions per Day | 6–8 sessions |
| Avg. Session Length | ~5 minutes |
Fastest Growing Instagram Regions (2025)
- Asia-Pacific: With India and Indonesia being the major contributors to the increasing user base of the photo-sharing app. India itself has more than 350 million active users on Instagram.
- North America: While, there is no decline in the number of users in this region, it is growing by just 1-2 per cent year-on-year, as per the data provided by Kepios.
- Latin America: Countries such as Brazil and Mexico have registered strong engagement, particularly when it comes to watching videos.
- Africa and Middle East: Even though these two regions have the lowest number of users, they are growing at a rate of up to 10 per cent year-on-year.
| Region | Annual Growth Rate |
|---|---|
| Africa | 8–10% |
| Southeast Asia | 6–8% |
| Latin America | 5–7% |
| Europe | 2–3% |
| North America | 1–2% |
So… What Does This Actually Mean?
Here’s where things get a little philosophical. Instagram is no longer a product, but a collection of actions taken by its users. The person swiping through Reels in the Philippines is having a different experience from someone looking at their Stories in New York, and that matters.
Because as a brand, creator, or even just as a person that’s trying to “figure out the algorithm”, you’re not trying to reach one group of people, you’re trying to reach many.
Me? I think it’s both exciting and a little scary. It’s definitely more opportunity, but it’s also more noise, more competition, more chaos. Instagram in 2025 isn’t simpler. It’s just… bigger, more complex, and a hell of a lot more human.
Average Time Spent on Instagram in 2025: Daily Usage Trends by Age Group
How Much Time Are We Really Spending?
You’d think people would be getting tired of scrolling by now. Apparently not. In 2025, the average Instagram user spends around 30 to 35 minutes per day on the app. That number hasn’t skyrocketed recently, but it hasn’t dropped either-which says a lot. It’s sticky. Almost suspiciously so.
Data from platforms suggests that while total time hasn’t exploded, session frequency has increased. In other words, people aren’t necessarily staying longer-they’re just coming back more often. Quick check-ins. A Reel here, a Story there. It’s fragmented, almost like snacking instead of sitting down for a full meal.
And if you’re wondering whether that’s intentional or just habit… well, that’s a whole different conversation.
| Metric | Value (2025) |
|---|---|
| Avg. Daily Time Spent | 30–35 minutes |
| Avg. Sessions per Day | 6–8 sessions |
| Avg. Session Length | ~5 minutes |
Gen Z: The Scroll Never Sleeps
Gen Z users (16-24 years old) are still clocking the most hours, but even within that group, I’m seeing some nuance. They spend an average of 35-45 minutes per day on Instagram. That’s not that much more than the overall average, but their usage patterns are different.
Faster, more reactive, more video-driven. According to reports from datareportal and statista, Gen Z users are much more likely to engage with Reels and short-form video, often in quick bingeing sessions.
They’re not always “watching,” they’re just scrolling, tapping, skimming, double-tapping, and repeating.
I’ve also observed, and maybe you have too, that Gen Z doesn’t use Instagram as a highlight reel in the same way as other generations. It’s more low-key, sometimes a bit raw. Less “present-y.” More post-and-forget. I think that alone might be why they’re willing to spend so much time on the app, it doesn’t feel as draining.
Millennials: They’re Still Around, They’re Just More… Intentional
Millennials (25 to 40 years old) are clocking in around 30 to 40 minutes a day on Instagram. A little less frenzied than Gen Z, but equally as present. What’s the caveat? They’re a tad more… deliberate. At least, that’s what they tell themselves, millennials are spending more time on Stories, DMs, and consumed content.
They’re catching up on friends, watching creators, possibly even buying some stuff. Instagram has become a tool for this demographic, not just a past time. There’s some nostalgia at play here too. Millennials came of age with Instagram.
They still remember when it was just square photos and Valencia filters. Even if they grumble about the algorithm (they do), they’re not going anywhere.
Gen X: Quietly Consistent
Consistent Gen Xers (41 to 56) are the least discussed generation on social media and, ironically, they are the most consistent. The average amount of time spent daily on Instagram is between 25 and 30 minutes. Gen X users are more likely to passively consume content, watch videos, view stories, and not post as frequently as other generations.
They are not trying to keep up with the latest social media trends, and they certainly are not concerned with going viral. However, Gen Xers are consistent and once they adapt to a platform, they will stick with it. There are no public announcements about leaving social media. No fuss, no muss. According to data from datareportal.com
Boomers: Small but Growing
Age 57 and above, Boomers are the least represented demographic on the platform, but they’re growing at a faster rate than you’d think. According to Statista they spend an average of 15-20 minutes per day on the app.
They aren’t exactly obsessed, but they are interested. They want to see updates about their grandkids, their friends’ vacations, or the occasional Reel that somehow manages to be unexpectedly hilarious.
In a weird way, I kind of admire the way Boomers use Instagram. There’s just a lot less comparing, a lot less of trying to one-up everyone else. More of an, “aw that’s nice,” vibe.
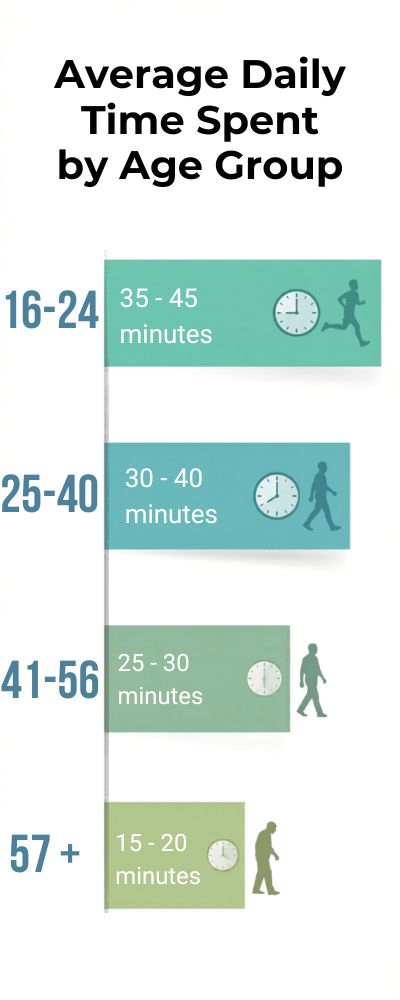
Average time spent on Instagram by age in 2025
| Age Group | Avg. Daily Time Spent |
|---|---|
| 16–24 | 35–45 minutes |
| 25–40 | 30–40 minutes |
| 41–56 | 25–30 minutes |
| 57+ | 15–20 minutes |
So… Is This a Lot or Just Normal Now?
This is the part where I get a little subjective. Numbers are one thing. The meaning we attach to them is something else. 30 minutes a day doesn’t feel like a lot. But that’s 3.5 hours a week. Then it feels like a lot. But perhaps it’s not.
Perhaps this is just how much time we spend on Instagram now. Like drinking coffee. Or checking email. Or aimlessly staring at walls. And whether that’s healthy or not… well, I dunno. I’m still working that out for myself.
Instagram Demographics 2025: Age, Gender, Income & Behavioral Insights
What is the average age on Instagram? What is the age distribution of Instagram users? How old are the most popular users on Instagram?
Who’s Actually Using Instagram in 2025?
When you think of the “average Instagram user,” what do you imagine? A teenager posting selfies? A travel influencer? Someone scrolling mindlessly at 2 a.m.? The answer is all of the above. Instagram users in 2025 are both plentiful and surprisingly varied, but still skew young.
Some 60 percent of users are between the ages of 18 and 34, making it one of the more youth-dominant platforms, the 18 to 24 age group alone comprises around 30 percent of users.
It is worth noting, however, that the 35–54 group is also substantial and not as inactive as you might expect. They’re not just looking, they’re buying, too. And even creating. Instagram isn’t just a “young person’s app” anymore, even if the myth still lingers.
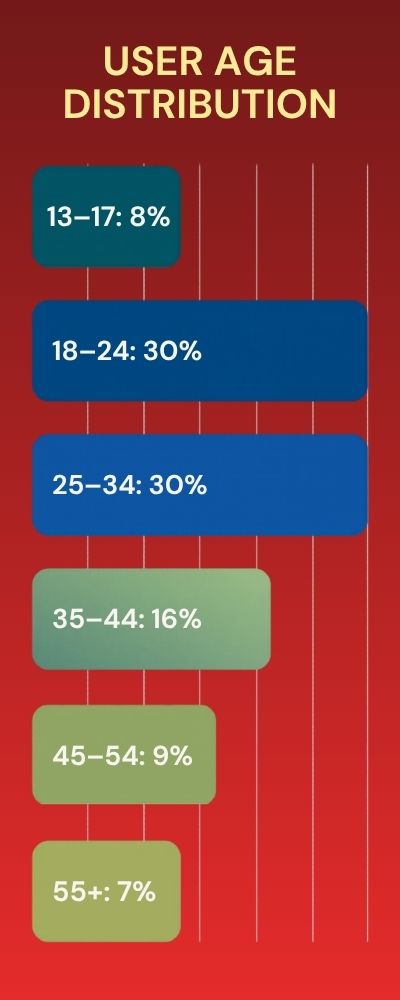
Instagram Age Distribution (2025)
| Age Group | Share of Users |
|---|---|
| 13–17 | ~8% |
| 18–24 | ~30% |
| 25–34 | ~30% |
| 35–44 | ~16% |
| 45–54 | ~9% |
| 55+ | ~7% |
Gender Breakdown: More Balanced Than You’d Think
For a long time, Instagram was perceived as slightly more female-dominated-and to be fair, that was true. But in 2025, the gap has narrowed quite a bit.
Globally, the platform is now roughly 48% female and 52% male, according to estimates from Datareportal. That’s about as close to balanced as it gets in social media.
That said, regional differences still matter. In countries like India, male users significantly outnumber female users, while in parts of Europe and North America, the split is more even-or even slightly female-leaning.
And behavior-wise? There are patterns, sure. Women tend to engage more with lifestyle, fashion, and community-driven content, while men skew slightly toward sports, tech, and meme culture. But honestly, those lines are getting blurrier every year. People are messy. Interests overlap.
Income & Spending Power: Not Just Browsing Anymore
Now we’re talking. This is where it starts to get a bit more interesting, and a lot more practical. Because, at this point, Instagram isn’t just a social platform. It’s a marketplace. Generally speaking, people on Instagram lean toward the middle-to-high income side, particularly in developed markets.
As reported by Pew Research Center and confirmed by Statista, a large segment of U.S. users fall into the $50,000+ income category, with the most active segment coming from the $75,000+ income group.
Why is this important? Well, these users aren’t just scrolling; they’re buying. Between the shopping features, influencer marketing, and targeted advertising, Instagram has become a major consumer engine.
I’ve lost count of how many times I’ve clicked on something thinking, “I’m just browsing,” and then somehow ended up at checkout. It sneaks up on you.
Behavioral Insights: How Different Generations Actually Use Instagram
Ok let’s get a little more personal. Demographics tell us who is on Instagram, but behavior tells us why.
- Gen Z is fast, reactive and video heavy. Reels, fast, and authentic over perfect. Reportedly, according to datareportal.com, Gen Z likes short, raw, and the less “perfect” the better.
- Millennials are a bit more balanced. Socializing (Stories, DMs), entertainment (Reels, Explore) and commerce. Reportedly, according to data.ai, they’re one of the most commercially active generations on the app.
- Gen X and Boomers consume more than they create. Scrolling, watching, the occasional engagement, but they’re not trying to keep up. And, to be honest, that sounds a bit nice.
What I find interesting is that each generation uses the app differently. Like Instagram is multiple apps rolled into one, each age group living a slightly different reality.
Behavioral Insights of Instagram Users by Age Group (2025)
| Age Group | Primary Behavior |
|---|---|
| 16–24 | Reels, trends, fast consumption |
| 25–34 | Stories, shopping, creators |
| 35–44 | Feed browsing, community |
| 45–54 | Passive scrolling, video viewing |
| 55+ | Occasional use, social updates |
So… What Should You Take From This?
Ultimately, I think you should accept that Instagram is not one audience. It’s multiple audiences. Different behaviors, different preferences, different reasons for using the app. They all exist together, in one, sometimes messy, ecosystem.
And maybe that’s how it’s survived this long. It’s flexible. It morphs. It tries to be everything to everyone, even if that means being a bit messy at times.
In my view, that’s both a good thing and a bad thing. It makes it more interesting, but also harder to define.
Though maybe that’s the appeal.
Instagram Revenue Statistics 2025 Ad Revenue, ARPU & Monetization Breakdown
Instagram is making money. A lot of money. Like, a really, really, really lot of money. It’s easy to forget because it doesn’t feel like we’re being monetized all the time. But we are.
In 2025, we estimate that Instagram will generate between $65-$75 Billion in revenue. Almost all of that revenue will come from ads. Instagram is likely to account for over 40% of Meta’s ad revenue in 2025, according to analysts at EMarketer and Meta’s revenue.
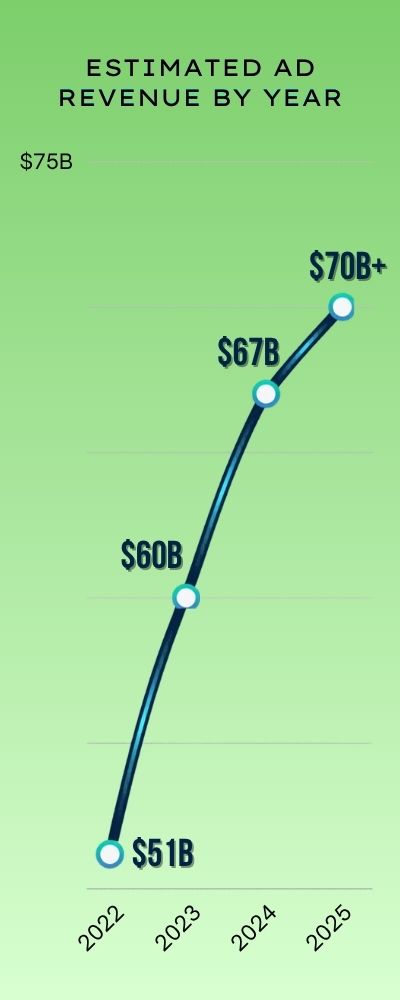
📊 Instagram Ad Revenue Growth (2025)
| Year | Estimated Ad Revenue |
|---|---|
| 2022 | ~$51 Billion |
| 2023 | ~$60 Billion |
| 2024 | ~$67 Billion |
| 2025 | ~$70+ Billion |
Advertising: The Real Money Maker
No need to beat around the bush; advertising is where Instagram makes its money. Whether it’s a sponsored post, a Story ad, a Reel ad, a carousel ad, or any other form of ad, it’s all the same, with a different name. In 2025, it’s estimated that over 98% of Instagram’s revenue will come from advertising, according to statista.com.
And, no, advertisers aren’t being cheap; they’re spending money because, love it or hate it, Instagram still offers them the one thing they need the most, attention. Because, at the end of the day, attention is money.
The cost-per-click (CPC) and cost-per-thousand impressions (CPM) differ greatly depending on your audience, however, the average CPM on Instagram ranges anywhere between $6-$12, with the highest rates being in North America and Europe.
As a marketer, Instagram is still a relatively safe place to invest your money; as a user, sometimes it feels like you’re scrolling through a mall that’s masquerading as a social media feed, which isn’t a bad thing, necessarily. Just something to keep in mind.
ARPU (Average Revenue Per User): Who’s Worth the Most?
Here’s where things get a little disproportionate, and, kinda, a little uncomfortable. Because not all users are created equal in the eyes of an advertiser.
In 2025, it’s estimated that Instagram’s global Average Revenue Per User (ARPU) will be anywhere between $25-$30 per year, according to aggregated data from statista.com and insiderintelligence.com.
But that’s just an average. In the United States and Canada, for example, ARPU can be over $100 per user per year, whereas in other regions like Asia-Pacific or Africa, it can be under $10 per user per year. Same app; different price tag.
And, yeah, it kinda feels a little funny when you think about it like that, every time you scroll, you have a price tag on your head. Some of us are just… worth more than others.
Instagram ARPU by Region (2025)
| Region | Estimated ARPU |
|---|---|
| North America | $100+ |
| Europe | $40–$60 |
| Latin America | $15–$25 |
| Asia-Pacific | $8–$15 |
| Africa/Middle East | $5–$10 |
Beyond Ads: Shopping, Creators & New Revenue Streams
Advertising is king, but Instagram has been experimenting with other revenue streams, and some are catching on.
- Instagram Shopping
- Explore
- Browse
- Buy
All without leaving the app. Social commerce is predicted to top $1 trillion globally by 2025, with Instagram playing a starring role.
Creators: Subscriptions, brand deals, affiliate marketing. Instagram doesn’t take a massive cut… yet. But they do benefit by keeping creators (and their followings) inside the ecosystem.
This is where I think they’re going, long-term. They’ll always have ads. But the next step feels more… seamless. Less “buy this now,” and more “you just discovered this organically… and now you want it.”
Instagram Revenue Breakdown (2025)
| Revenue Source | Share of Total Revenue |
|---|---|
| Advertising | ~98% |
| Shopping & Commerce | ~1–2% |
| Creator Tools/Other | <1% |
So… What’s the Bigger Picture Here?
Instagram is not just an app. It’s an economy. Every minute you spend on the app, every post you like, and every second you watch is monetized. I’m not gonna lie, this is both brilliant and creepy at the same time.
On the one hand, kudos. On the other, it makes you question what’s curated for you versus what you’re shown. In any case, one thing is certain. Instagram as we know it in 2025 is not just about content. It’s about money.
How Much Do Brands Spend on Instagram? Advertising Costs & ROI Statistics (2025)
Brands aren’t just “testing” Instagram anymore… They’re investing. In fact, total global ad spend on Instagram in 2025 is projected to reach over $70 BILLION.
This isn’t shocking anymore. Just a few years ago, brands would run “a test” campaign on Instagram. Now it’s just expected. Small business owners, solo entrepreneurs, heck, even local coffee shops are spending money on Instagram ads. It’s easy to get started… perhaps too easy!
| Year | Estimated Ad Spend |
|---|---|
| 2022 | ~$52 Billion |
| 2023 | ~$60 Billion |
| 2024 | ~$67 Billion |
| 2025 | ~$70+ Billion |
How Much Do Instagram Ads Cost?
The million-dollar question: what does it all cost? As you might expect, the answer is: it depends. The average cost of an Instagram ad in 2025 ranges from $0.50 to $1.50 per click and $6-$12 per 1,000 impressions, benchmarks from Wordstream and Datareportal. But, as you can probably tell, that can vary a lot depending on your target audience, industry, and even the time of year.
Fashion brand in the US targeting during the holiday season? That’ll cost you. Small B2B business targeting a niche audience? That’ll be cheaper, but also harder to scale. And let’s be real, sometimes it feels like you’re just tossing some money at the algorithm and praying. Some days your ads will perform great. Other days…not so great.
📊 Average Instagram Ad Costs (2025)
| Metric | Average Cost |
|---|---|
| Cost Per Click (CPC) | $0.50 – $1.50 |
| Cost Per 1000 Impressions (CPM) | $6 – $12 |
| Cost Per Engagement (CPE) | $0.01 – $0.05 |
ROI: Are Brands Actually Making Money?
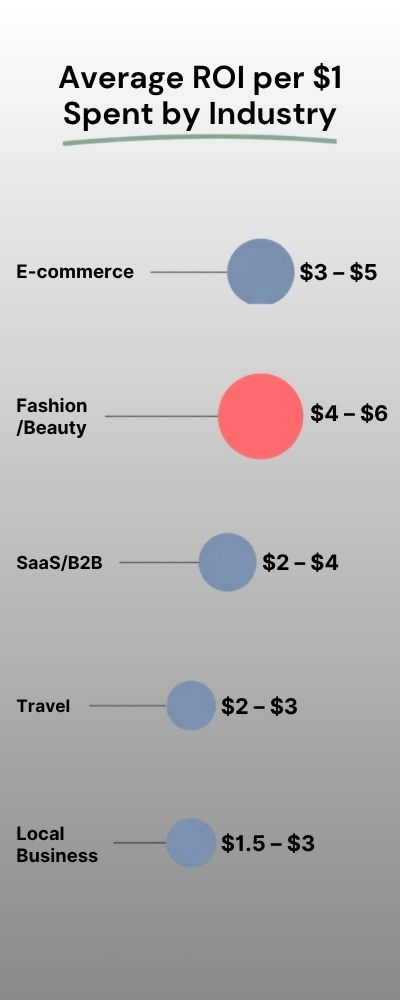
Now we’re getting to the juicy stuff. And the more realistic side of things. You can spend a lot of money. But what’s important is what you’re getting back. The estimated return on investment (ROI) for businesses using Instagram ads ranges from $2 to $5 per dollar invested, depending on the industry.
These estimates are based on ad performance reports and surveys conducted by Hootsuite and Sproutsocial. E-commerce brands, in particular, seem to get a high return on investment thanks to the visual nature of the platform. You see a product. You make it look nice. You slap a “Shop Now” button on it. It’s an easy purchase decision.
Of course, not all campaigns are profitable. Some just don’t work. And those aren’t talked about as much. The winning campaigns get celebrated. The losing ones are swept under the rug.
Based on my experience, the brands that are winning on Instagram aren’t just investing more. They’re experimenting more. Testing new creatives. Tweaking audiences. Understanding what’s not working and learning from their mistakes. It’s not a “set it and forget it” thing. It’s more of a “tweak it over and over until it works” thing.
📊 Instagram Ad ROI by Industry (2025)
| Industry | Avg. ROI (Return per $1 spent) |
|---|---|
| E-commerce | $3 – $5 |
| Fashion/Beauty | $4 – $6 |
| SaaS/B2B | $2 – $4 |
| Travel | $2 – $3 |
| Local Business | $1.5 – $3 |
Influencer Marketing: The Hidden Ad Spend
Now, this is a part that isn’t always reflected in ad revenue reports, influencer marketing.
Brands are spending billions on influencer marketing, and Instagram is still the leading platform for that. In 2025, the global influencer marketing industry is projected to hit $24 billion, with a big portion of that likely going through Instagram.
The cost of this? Highly variable. A micro-influencer might charge $100 per post, while major influencers can charge tens of thousands, or more.
The strength of this lies in trust. People might not trust ads, but they trust the people they follow. Well, at least they feel like they do. And that nuance is what brands are paying for.
Average Influencer Costs on Instagram (2025)
| Influencer Tier | Cost per Post |
|---|---|
| Nano (1K–10K) | $10 – $100 |
| Micro (10K–50K) | $100 – $500 |
| Mid-tier (50K–500K) | $500 – $5,000 |
| Macro (500K–1M) | $5,000 – $10,000 |
| Mega (1M+) | $10,000+ |
So… Is It Worth It?
Here’s where things get subjective. The figures are impressive, as I mentioned. But they’re not always indicative of the outcome. Instagram advertising delivers.
You can’t argue with that. But it isn’t magic. It just requires some effort, persistence, and time. You won’t get overnight results from it. At least not usually.
In my experience, I still believe Instagram is one of the highest returning platforms in terms of investment. That’s assuming you know what you’re doing with it. If not, you can waste a lot of money on it very quickly.
Perhaps a more important question than “What do brands spend?” is, “What are brands getting back from that spend?”
Instagram vs TikTok vs YouTube: Revenue, Engagement & Growth Comparison (2025)
The Battle for Attention (and Money)
Whether it’s scrolling through Reels, going down a TikTok rabbit hole, or saying “I’ll just watch one YouTube video” and it being 2 am, these platforms are now vying for time, money, and culture as much as for users.
Fast forward to 2025, all three are monsters but operate in different paradigms; Meta Platforms’ Instagram reigns over social commerce and visual-based ads, TikTok reigns over short-form content and YouTube long-form content and the depth of monetization.
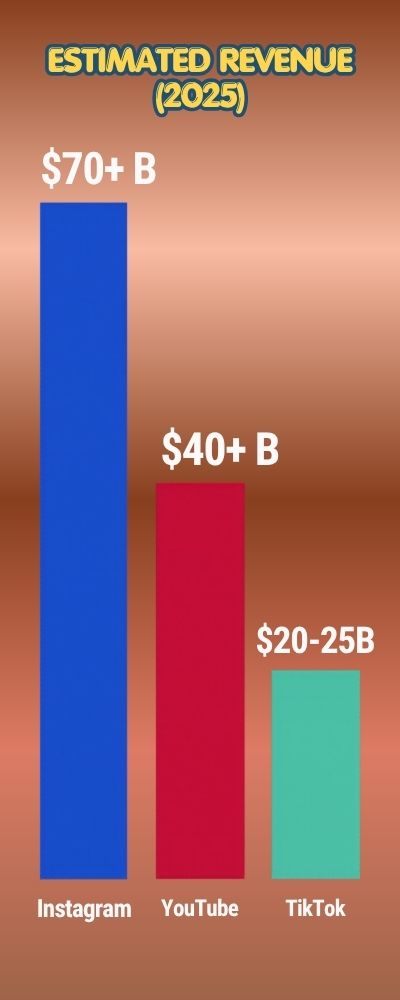
From a revenue standpoint, YouTube comes first with estimated revenue in 2025 projected to be over $40B, TikTok comes second with revenues of $20B-$25B and Instagram is above those at around $70B+ (primarily from ads).
However, revenue isn’t the best metric to judge, that would be attention. And attention is… messy.
Platform Revenue Comparison (2025)
| Platform | Estimated Revenue (2025) |
|---|---|
| $70+ Billion | |
| YouTube | $40+ Billion |
| TikTok | $20–25 Billion |
Engagement: Where Are You Spending All Your Time?
Now, this is where we get a bit emotional because engagement is emotional. TikTok has the highest engagement, with an average of 45-60 minutes of daily time spent on the app. This is highly engaged, because the algorithm is almost too good at knowing what you want before you know you want it.
The middle ground is Instagram, with an average of 30-35 minutes of daily time spent, but with more sessions per day. This makes sense, because you’re probably opening up the app more frequently throughout the day, but not spending as much time per session.
Lastly, we have YouTube, with an average of over 40 minutes per day, but with fewer sessions. This makes sense because you’re probably going to the platform with the intent of watching a video, but then you end up staying longer than you anticipated… every time.
How would I sum this up? TikTok hooks you. Instagram pings you. YouTube sucks you in.
📊 Average Daily Time Spent by Platform
| Platform | Avg. Daily Time Spent |
|---|---|
| TikTok | 45–60 minutes |
| YouTube | 40+ minutes |
| 30–35 minutes |
Growth: Who’s Still Growing?
This is where the tables turn. TikTok is growing the fastest, especially amongst younger users. It’s expected to have over 1.8 Billion users worldwide in 2025, with the highest penetration in Asia and the U.S. Instagram is growing at 3-5% per year, however, that’s off a base of 2.4 Billion users.
Here, the focus is less about growing, and more about retaining and monetizing. YouTube is the sleeping giant in this equation, with over 2.7 Billion monthly active users, still growing, but much slower. It kinda feels like TikTok is the disruptor, Instagram is the adapter, and YouTube is just… merrily marching on.
User Growth Comparison (2025)
| Platform | Users (2025) | Growth Rate |
|---|---|---|
| 2.4B+ | 3–5% | |
| YouTube | 2.7B+ | 2–4% |
| TikTok | 1.8B+ | 8–10% |
Monetization: Which platform pays creators the best?
Well, this is one of those questions where the answer depends on who you ask… and where they make most of their money from. Let me explain.
YouTube is the undisputed king of creator monetization. From ad revenue share to memberships to Super Chats, creators can earn money on the platform in multiple ways. By contrast, Instagram and TikTok have traditionally relied more on branded content, sponsored posts and shopping, rather than paying creators directly.
Sure, a successful branded campaign can earn you decent money. But it isn’t a guaranteed income stream, and it isn’t always consistent.
For example, although TikTok has a massive audience reach, it still lags behind other platforms when it comes to the size of the creator funds it offers. In other words, although there is definitely money to be earned on TikTok, it isn’t always as much as you’d expect.
TikTok makes you famous, Instagram helps you sell things, and YouTube helps you pay your bills.
📊 Creator Monetization Comparison
| Platform | Monetization Strength |
|---|---|
| YouTube | High (ads, memberships) |
| Medium (brand deals, shops) | |
| TikTok | Low–Medium (creator fund) |
So… Which Platform Wins?
Here’s the thing. There isn’t a clear winner. Each platform has its pros. If you’re after views and virality, you can’t go past TikTok. If you want a blend of engagement and earning potential, Instagram is still your go-to. And if you want endurance and passive income, then it’s all about YouTube.
Personally, I think that’s the beauty of it all. I don’t think it’s an either/or situation anymore. Most of us are already active on all three. We’re just customising our content for each of the different ecosystems.
And perhaps that’s the lesson to be learned here. Instead of pitting them against each other, perhaps we should just accept that they’re all growing and changing. Together. Like it or not.
Instagram Engagement Rates 2025: Posts vs Reels vs Stories Performance Data
![]()
![]()
What Does “Engagement” Even Mean Anymore?
Engagement used to be simple. Likes, comments, maybe a share if you were lucky. Now? It’s saves, shares, watch time, replies, taps forward, taps back… honestly, it feels like Instagram turned engagement into a full-blown science experiment.
In 2025, the average engagement rate on Instagram sits between 0.5% and 1.2% per post, depending on follower size and niche. That’s based on aggregated benchmarks from. Smaller accounts (under 10K followers) tend to see higher engagement-sometimes 2–4%-while larger accounts often struggle to break 1%.
And yeah, that can feel a bit discouraging. You put effort into a post, and the numbers don’t always reflect it. But that’s the game now-reach is harder, attention is fragmented, and the algorithm… well, it has moods.
Feed Posts: Still Relevant or Slowly Fading?
They’re not dead, but they’re not really the star of the show anymore either. A recent study by RivalIQ shows that in 2025, the average engagement rate for feed posts falls between 0.5-1%.
On average, carousels perform better than single image posts and are often designed to entice the user to keep swiping (spending more time on the content). Despite this, feed posts aren’t going anywhere.
Not only do they stay on your page, but they also build your page, your brand, your look. Reels may get you noticed, but posts are what give you your identity.
I think we can also safely say that people put a lot more thought into their posts now than they used to. People don’t just post anything anymore, they post what’s been curated. That may contribute to the drop in engagement. It’s higher stress, higher reward, lower spontaneity.
Average Engagement Rate by Post Type (2025)
| Content Type | Avg. Engagement Rate |
|---|---|
| Image Post | 0.5% – 0.9% |
| Carousel | 0.8% – 1.2% |
| Video Post | 0.6% – 1.0% |
Reels: The Engagement Engine
Reels are impossible to avoid. You open the app, and there they are. Scroll, scroll, scroll. 20 minutes have just passed.
Their performance is massive. Reels can achieve 2-3 times more reach than feed posts and typically have an engagement rate between 1% and 2.5% (even more for smaller creators) according to Later and Social Insider.
The thing is, engagement on Reels isn’t like “engagement”. Not as many likes and comments but more views, watch time, and shares. Lower engagement, but higher reach.
There’s also a bit of randomness about Reels. You can spend all day working on one and it bombs. You post something silly and it goes viral. No rhyme or reason. Pure vibe and algorithm.
Reels Performance Metrics (2025)
| Metric | Typical Range |
|---|---|
| Engagement Rate | 1% – 2.5% |
| Reach Multiplier | 2x – 3x vs posts |
| Avg. Watch Rate | 30% – 50% |
The Unsung Hero Of The Family: Stories
Stories aren’t that popular. They aren’t as shareable as other formats, but they are great for nurturing. As of 2025, the average Story view rate is 5-10% of your audience. The average completion rate depends on how many frames you post. Data sourced via socialinsider.io and hootsuite.com
Engagement is on a smaller scale: polls, responses, sticker clicks. It’s not as “shouty” as other formats; it’s more of a dialogue.
In fact, this is where Instagram feels most real. It’s less curated, more raw. You don’t overanalyse posting a Story; you just do it. That’s why it’s more believable.
Instagram Stories Metrics (2025)
| Metric | Average Value |
|---|---|
| View Rate | 5% – 10% |
| Completion Rate | 70% – 90% |
| Interaction Rate | 1% – 5% |
So… What’s Actually Working?
Now we get to the annoying part: it depends on your goals.
- Want reach? Use Reels.
- Want reliability and branding? Use posts.
- Want engagement? Leverage stories.
Personally I think the issue is when people only focus on one thing. In 2025 I think Instagram is going to reward those who play the whole field: Reels for reach, posts for branding, and stories for engagement. And sure, it’s exhausting. But it is what it is at this point. Instagram isn’t a one way street. It’s a highway.
What Content Performs Best on Instagram in 2025? (Reels, Carousels, Stories & Lives)
So… What Actually Works Right Now?
You’d think after all these years there’d be a clear answer. Post this, get likes. Do that, go viral. But Instagram in 2025 doesn’t really work like that anymore-it’s less formula, more… feel.
Still, patterns exist. Data shows that video-first content dominates, especially short-form. Reels consistently outperform other formats in reach and discovery, while carousels and Stories hold their ground in engagement and retention.
What surprised me, though, is how much intent matters now. It’s not just what you post-it’s why someone would stop scrolling for it. That sounds obvious, but it’s easy to forget when you’re just trying to “stay consistent.”
Reels: The King of Reach
Reels are what’s going to give you reach. Full stop.
As of 2025, Reels are giving 2 to 3x the reach of any other type of content, and they’re taking over the Explore page. In fact, accounts that post Reels see more follower growth on average than accounts that only post feed posts.
However, successful Reels don’t feel like an ad, or a highly produced piece of content. They feel raw, fast, and a little disposable. Things like trends, stories, quick tutorials, behind the scenes clips, etc. tend to do really well.
It’s infuriating at times, you can take all day to edit a “perfect” reel and it tanks. You post a 7 second video you almost didn’t even upload, and it does amazing. Welcome to the Reels reality of 2025.
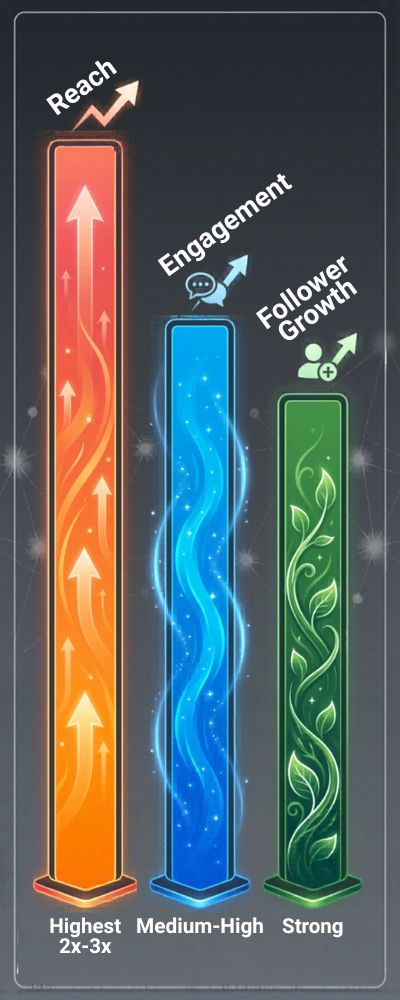
📊 Reels Performance Snapshot (2025)
| Metric | Typical Performance |
|---|---|
| Reach | Highest (2x–3x) |
| Engagement | Medium–High |
| Follower Growth | Strong |
The Unsung Heroes of Carousels
Carousels are not as sexy, but they’re an unsung hero if done right. RivalIQ states that a carousel post (multiple slides) has an average engagement rate of 1.2%, higher than a single image post. Why? Because they make you stay longer. Swiping = longer time spent = higher engagement.
Use this format for educational content, tutorials, “save this for later” posts. I feel carousels are underestimated. They don’t do well in the virality department, but they can help build trust. And that’s worth more than going viral sometimes.
📊 Carousel Content Performance
| Metric | Performance Level |
|---|---|
| Engagement | High |
| Reach | Medium |
| Saves | Very High |
Stories: Where Real Connection Happens
Stories are less about performance metrics and more about… staying relevant. Staying present.
In 2025, Story view rates average 5–10% of followers. That might not sound impressive, but the quality of engagement is different. Polls, replies, DMs-it’s more direct, more personal.
This is where people show up as themselves. Messy, unfiltered, sometimes random. And honestly, that’s why it works.
If Reels are for growth, Stories are for loyalty. That’s how I see it.
📊 Stories Performance Snapshot
| Metric | Typical Range |
|---|---|
| View Rate | 5% – 10% |
| Replies/DMs | Low–Moderate |
| Retention | High (short bursts) |
Instagram Live: Underrated or Just Underused?
Live video is… complicated. It has potential, but it’s not as widely used as other formats. Engagement during Lives can be very high, real-time comments, direct interaction, but overall reach is limited compared to Reels. According to Hootsuite, only a small percentage of users go live regularly, but those who do often build stronger audience relationships.
The challenge is commitment. Going live requires time, energy, and a bit of courage. You can’t edit it, can’t polish it. It’s raw. And maybe that’s why it works when it does. It feels real. But yeah, it’s not for everyone.
Instagram Live Performance
| Metric | Performance Level |
|---|---|
| Engagement | Very High (live) |
| Reach | Low–Medium |
| Audience Loyalty | Strong |
Now… What SHOULD You Post? 🤔
I know you want me to say something like ‘post this, to beat the algorithm’. Unfortunately it’s not that simple. 2025’s highest performing content is less about content types, more about intent.
- Reach? Reels
- Engagement? Carousels
- Connection? Stories
- Depth? Lives
In my view, the magic is in a mix of all the above, but without overcomplicating it. Easier said than done, I get that. But maybe that’s the real pivot… Instagram is beginning to favour the experimental, over the rule-abiders.
Instagram Algorithm 2025: How the Algorithm Works, and What Affects Your Reach and Visibility
There is no single algorithm
There is no such thing as “the algorithm”. The algorithm is in fact a set of algorithms. Each set of algorithms ranks content for a specific surface, such as Feed, Reels, Stories, and Explore.
This is something confirmed by Meta Platforms, Inc. (for the latest on what they’re doing, you can find their latest announcements at About Instagram. The result of this is that your content will perform well in one place, and not so well in another. Yes, that does make things a bit confusing.
The Core Ranking Signals (Still the Foundation)
Despite the updates, there are still core signals the algorithm considers:
- Your past interactions (how you’ve interacted with them in the past)
- The likelihood you’ll be interested in the post (how relevant the content is to you)
- How recently the post was published (how fresh the content is)
According to data-driven reports, the engagement in the first 30-60 minutes of posting can influence how many people see your post: likes, comments, saves, shares, etc. serve as early signals.
The caveat here is that it isn’t just about how many people are engaging with your post, but who is engaging with your post: getting engagement from your best friends outweighs getting engagement from random accounts. Quality over quantity, right? (I know, I know, it sounds so cliché, but it’s true in this instance).
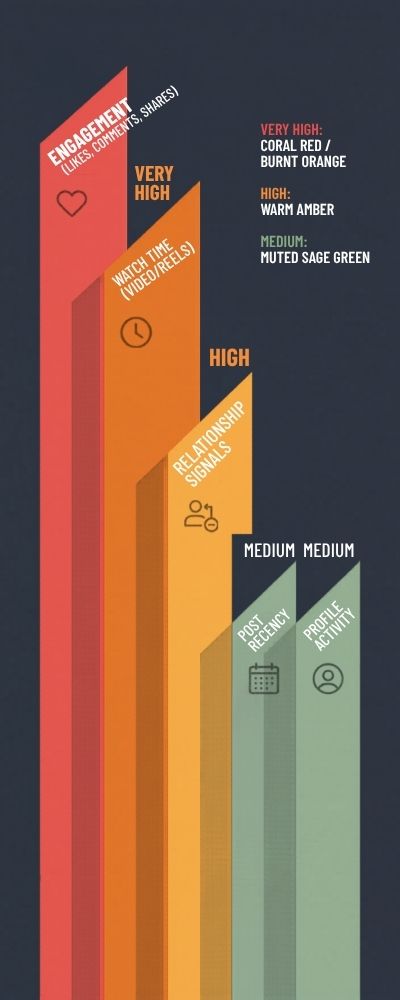
📊 Key Instagram Ranking Factors (2025)
| Ranking Factor | Importance Level |
|---|---|
| Engagement (likes, comments, shares) | Very High |
| Watch Time (video/Reels) | Very High |
| Relationship Signals | High |
| Post Recency | Medium |
| Profile Activity | Medium |
The ONE Thing You Need to Understand About Reels in 2025
Watch time over everything. Reels that get completed (or rewatched) are the ones that perform. In fact, Reels with completion rates above 40 to 50% have a higher likelihood of reaching a larger audience, according to socialinsider.io
That means we’re focused on hooks within the first 2 seconds, fast-paced content, loopable Reels, it’s almost psychological. I see creators sweating over this. I don’t blame them. When it works, it WORKS. But when it doesn’t, crickets.
📊 Reels Ranking
| Signal | Impact Level |
|---|---|
| Watch Time | Very High |
| Replays | High |
| Shares | High |
| Likes/Comments | Medium |
Feed posts are a bit more personal, and so is the algorithm
As of 2025, the feed favors posts from people you care about. If you like, comment, or DM a friend a lot, you’ll see their posts closer to the top. Relationship signals are still one of the most important ranking signals for feed posts.
That’s why some accounts might seem “shadow banned” despite posting good content regularly. It’s not always about you, it’s about the people you care about. And honestly, that sucks. But it kinda makes sense. Instagram wants to feel social, not algorithmic.
Stories Algorithm: Consistency is Key
Stories work on a different principle. It’s not about discoverability. It’s about predictability and consistency. When you post Stories consistently, you’re more likely to appear at the front of the users’ Story bars.
According to a study, posting frequently helps in improving your reach even if you’re not getting a lot of engagement on your individual stories. It’s as if Instagram is saying, “Hey! If you show up every day, I’ll make sure you’re visible every day. But if you go MIA, so will your views!” Easy peasy…or is it?
Stories Visibility Metrics
| Factor | Importance Level |
|---|---|
| Posting Frequency | Very High |
| Direct Interactions (DMs, replies) | High |
| Completion Rate | Medium |
Nope. Reach Is Down… Or Is It Just Different?
I see a ton of commentary from creators that reach is down in 2025. Technically, this is true for feed posts. Average reach ranges from 10 to 20% of your audience for regular posts.
That said, that doesn’t mean that your overall reach is down; it’s just changed. Reels account for most of the discovery on the platform. If you’re still only posting static content, well, it makes sense that you feel like you’re being largely ignored. The platform has moved on.
So… Can You “Beat” the Algorithm? 🤔
This is where people usually look for a hack. A trick. A way to game the system. I don’t think that exists anymore. At least, not in a reliable way. The algorithm in 2025 incentivizes content that people actually want to engage with. Not perfectly polished, not overly strategic, just relevant, interesting, human.
And yeah, that sounds vague. But maybe that’s the point. In my experience, the people that are succeeding aren’t trying to control the algorithm; they’re learning to work with it. To test, and learn, and adjust. It’s less about control these days and more about going with the flow.
How Gen Z Uses Instagram in 2025: Behavior Shifts, Trends & Platform Preferences

The Gen Z cohort may have started by using Instagram, but they gradually changed the face of the platform. And you know it, even if you can’t quite put your finger on how 16 to 24-year-olds comprised approximately 30% of Instagram’s global user base in 2025. That’s a massive proportion, and more importantly, they are the ones that dictate the pace of emerging trends.
However, they use Instagram very differently to older age groups. They tend to post more short-form, ephemeral, low-effort content. It’s no longer about making your life look perfect, it’s about posting the moment, and then it’s gone. I think this reflects their more relaxed relationship with social media in general, but we’ll get into that later.
Passive Scrolling vs Active Posting
Another big difference? Gen Z posts less, but consumes more. Per reports from datareportal.com , Gen Z users are much more likely to scroll, watch, and engage passively, rather than actively post to their feed.
Stories and DMs have taken over the feed as the main way Gen Z communicates. It’s almost as if the public feed is a stage, and not everyone wants to perform anymore. I see this all the time, where people overthink a post, edit for hours, and then just… don’t post.
But they’re still on stories or in group chats all day. It’s a more subdued form of participation, but participation nonetheless.
Gen Z Instagram Behavior (2025)
| Behavior Type | Frequency Level |
|---|---|
| Scrolling/Reels | Very High |
| Stories Viewing | High |
| Feed Posting | Low–Medium |
| DM Interaction | Very High |
Reels are the Love Language of Gen Z Instagram
If you’re trying to understand Gen Z on Instagram, you have to start with Reels. Short-form video content is not just how they consume content on Instagram, but it is the dominant form of how they experience the app.
According to Later.com and Socialinsider.io, Gen Z users spend a majority of their Instagram time watching Reels, often in rapid, continuous sessions. But it isn’t just that Gen Z is watching Reels, it’s that the content is, well, a little wild.
Reels trends come and go fast. What is trending today will be cringey by next week. Messy, unpolished, real content performs better than overly produced, perfected content. It’s ironic, for years we optimized our content to be perfect. Now if it is too perfect, we scroll on by.
DMs and Private Sharing are the Secret Social Currency of Gen Z
One of the things that I think is incredibly under-discussed is that Gen Z uses Instagram as much as a private messaging app as they do a content-sharing platform.
According to Statista.com, a large percentage of Gen Z users regularly share posts in direct messages (DMs) rather than liking or commenting on the content publicly.
I love sharing Reels to my friends via DM and adding a little note to the message. It feels intimate and low stakes. It also just feels more real. Liking and commenting publicly can feel like performance.
But DMing a post to a friend feels honest and real. It also means that engagement isn’t always public. Something might not have thousands of likes, but it might have been shared hundreds of times in DMs.
📊 Public vs Private Engagement (Gen Z)
| Engagement Type | Preference Level |
|---|---|
| Likes/Comments | Medium |
| Shares (DMs) | High |
| Story Replies | High |
🧠 Platform Preferences: Instagram vs TikTok
Ultimately, TikTok remains the hub for entertainment and discovery, while Instagram is about community and self-expression. Many Gen Zers regularly toggle between the two platforms for different reasons. That means that Gen Z hasn’t abandoned Instagram, but it has forced the app to evolve.
That’s why Reels, messaging, and moving away from the ‘perfect aesthetic’ are a thing. You can almost feel it: Instagram is trying to be chiller, more low-key, basically, the way Gen Z is.
Snapshot of Gen Z platform usage
| Platform | Primary Use Case |
|---|---|
| Social connection, DMs | |
| TikTok | Entertainment, discovery |
| YouTube | Long-form content |
So… What Does Gen Z Want?
Which is the tricky part… Gen Z is not a monolith. But if there’s a throughline, it’s that they like content that’s authentic, fast, and low-effort. They don’t want to spend 10 minutes on a post. They don’t want to feel the need to be flawless. They want it to be simple and woven throughout their routines.
That might also be why Instagram’s shifted so much. Not because it wanted to. Because it had to. In my view, Gen Z isn’t destroying Instagram. They’re making it into something that makes more sense for their digital behavior.
The Future of Instagram: AI, Shopping, Creators & Predicted Trends Through 2030
Where Is Instagram Actually Headed?
You can’t really know, but it’s fun to try. After all, there are clear directions-of-travel we can already see. And this year has already brought some significant changes to the app.
But looking ahead to future developments, here are 10 potential directions for the app, based on current trends and data insights, including forward-looking reports from Statista and DataReportal, which project that Instagram could reach between 2.8 and 3 billion users by 2030, based on current trends.
AI Is Quietly Taking Over (In a Helpful Way… Mostly)
AI is already integrated into Instagram, but as of 2030, AI will be integrated into… everything. We are talking recommendation algorithms, content editing tools, automated captioning, and even a personalized feed that changes in real time.
Meta Platforms has been investing a ton into AI and it is showing. According to McKinsey, AI-powered personalization can increase engagement across social media platforms by 20 to 30% in the next few years. That is massive.
The kicker though is: what happens when it becomes too much? What happens when it knows exactly what you want, before you know what you want? It is eerily impressive… but creepy when you think about it.
In-App Shopping
On social media is common, but what if it became the dominant way people shop in 2030? Social commerce is expected to hit over $1.2 trillion by 2027. With features like in-app checkout, product tagging, and live shopping on Instagram, social media is becoming a way to shop on a whim.
Allowing users to make purchases without ever leaving the social media app removes the risk of abandonment at checkout. Users will see, purchase, and feel with one touch of a button. This is a bit too easy and will make it hard to keep up with how much you’re spending.
| Year | Market Size |
|---|---|
| 2023 | ~$724 Billion |
| 2025 | ~$1 Trillion |
| 2027 | ~$1.2 Trillion |
The creator economy is not going anywhere; it’s just leveling up
It’s projected to grow to over $500 billion worldwide by 2030, according to Influencer Marketing Hub. Instagram will continue to be one of creators’ go-to platforms, but the way they monetize it will continue to shift.
We’re already seeing this happen with the growth of subscriptions, exclusive content, and native monetization features. A move away from sponsored posts and toward creators owning their revenue streams. Which, let’s be real, is probably for the best. Sponsored posts can be unstable. It’s time for something more sustainable for creators.
📊 Creator Economy Growth
| Year | Market Value |
|---|---|
| 2023 | ~$250 Billion |
| 2025 | ~$350 Billion |
| 2030 | $500B+ |
Content Trends: Shorter, Faster, More Real
Content isn’t getting longer; it’s getting faster. Short-form video will likely continue to dominate, but with an even stronger emphasis on authenticity and immediacy. Data trends from Datareportal suggest that users are increasingly favoring content that feels spontaneous rather than highly produced.
There’s also a growing fatigue with overly polished content. People want something they can relate to, not something that feels like an ad disguised as a lifestyle. Which is kind of ironic, considering how Instagram started. Full circle, in a way.
The Platform Itself: One App, Many Experiences
By 2030, Instagram will be a series of experiences:
- Entertainment (Reels)
- Messaging (DMs, private sharing)
- Shopping (in-app purchases)
- Community (Stories, groups)
It’s already happening. The distinctions between these features will get increasingly muddy. Perhaps this is the goal. The more time you spend within the ecosystem, the more valuable you are as a user. It’s not a negative statement. It’s just how the platforms are designed.
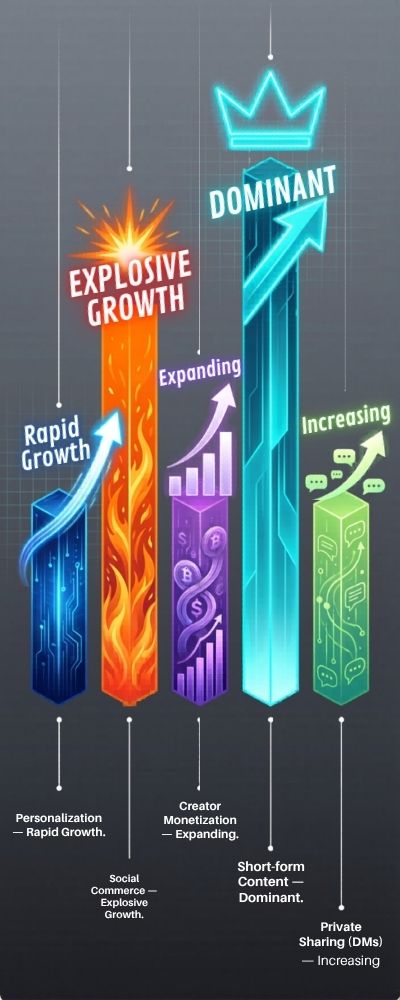
Key Instagram Trends Toward 2030
| Trend | Direction |
|---|---|
| AI Personalization | Rapid Growth |
| Social Commerce | Explosive Growth |
| Creator Monetization | Expanding |
| Short-form Content | Dominant |
| Private Sharing (DMs) | Increasing |
So… What Does the Future Feel Like?
This might sound silly, but if I had to describe what the future of Instagram feels like, I would say it feels more integrated, more personalized, and a little more intense. It will know you better. It will show you more relevant content. It will make it easier to purchase, communicate, and consume.
This is both thrilling and terrifying. How much personalization is too much? How much is too much? I’m not sure we know the answers to those questions yet, but it’s clear that Instagram isn’t going anywhere. It’s only going to continue to evolve. And ready or not, here we come…
Is Instagram Still Growing? User Retention, Decline Signals & Platform Saturation Analysis
Instagram is still growing-but it’s not the kind of growth that makes headlines anymore. It’s quieter, steadier, a bit more… mature.
As of 2025, the platform has surpassed 2.4 billion monthly active users, with annual growth hovering around 3–5%, based on combined estimates. Compare that to the double-digit growth years during the 2015–2020 period, and yeah-it’s clearly slowing down.
But slowing down doesn’t mean declining. It just means Instagram has reached a point where adding new users is harder because… well, most people who want it already have it.
It’s like a packed party. At some point, you can’t keep letting more people in-you just focus on keeping the ones inside entertained.
📊 Instagram User Growth Over Time
| Year | Users (Billions) | Growth Rate |
|---|---|---|
| 2020 | ~1.4B | ~12% |
| 2022 | ~2.0B | ~8% |
| 2024 | ~2.3B | ~5% |
| 2025 | ~2.4B+ | ~3–5% |
User Retention: The Real Metric That Matters
This is what we don’t hear about enough. Retention. Growth is sexy, but retention is how you sustain. And Instagram’s retention is solid, with a good percentage of users returning daily. Over 60% of users are daily active users.
But how? Well, Reels, Stories, and DMs are all measures to keep users coming back, multiple times per day. It’s not about keeping them on the platform for as long as possible, but rather, as often as possible.
And, if I’m going to be blunt, this is where Instagram gets it just right. It’s not about time spent on platform, it’s about frequency of visits. That nuance is actually brilliant.
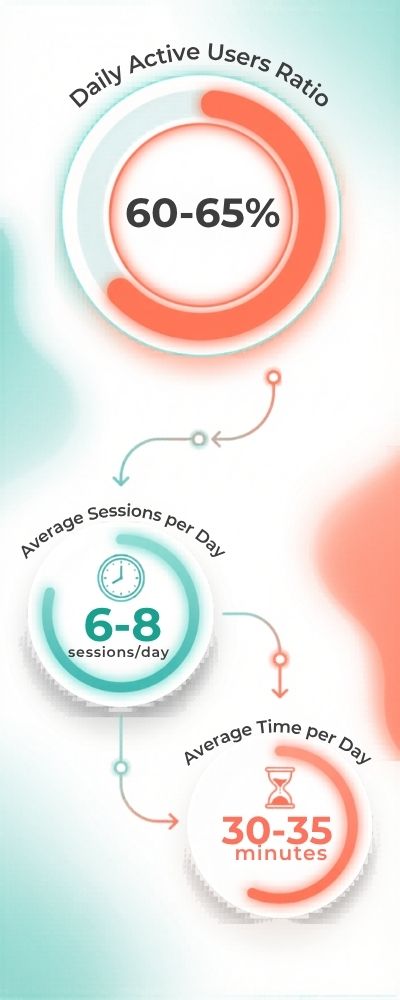
Instagram Retention & Usage (2025)
| Metric | Value |
|---|---|
| Daily Active Users Ratio | ~60–65% |
| Avg. Sessions per Day | 6–8 |
| Avg. Time per Day | 30–35 minutes |
Warning: Is The Platform Getting Overly Saturated?
Now, let’s play it safe, yes, the platform is getting more crowded. But that’s not true for every region. The growth rate for North America and Western Europe is 1-2 percent annually. Most of the people that could use Instagram are already on the platform.
That means there’s limited growth potential. Meanwhile, the number of content creators and content are growing. That means more competition for the same number of eyeballs. You’ve probably already noticed it. It’s harder to get your posts seen. It’s not you, it’s them.
That doesn’t mean the platform is shrinking; it just means it’s getting more competitive.
Growth Vs. Saturation By Region
| Region | Growth Trend |
|---|---|
| North America | Low (1–2%) |
| Europe | Low–Moderate |
| Asia-Pacific | High |
| Latin America | Moderate–High |
| Africa | High |
Decline Signals: What’s Actually Changing?
Next, I’ll address the part where you freak out because “Instagram is dying.” I know you’ve heard that before at least once. Is it true? No. But there are some changes you should be aware of.
- Decreased organic reach on feed posts
- More competition
- Higher expectations from audiences
Again, these aren’t decline signals, they are evolution signals. Instagram is changing, and some people are catching on faster than others. Frankly, I think the “decline” symptoms people are referring to are just symptoms of discomfort from change. The dynamics have changed, and it takes some time to adjust.
Is Instagram Still Growing or Not?
Truth is, yes and no. Yes, on a global level. No, on a mature market level. Yes and no when it comes to engagement and monetization. Perhaps the correct way to look at this is that we’re not in a growth stage anymore, we’re in an optimization stage.
And from where I stand, that’s not a terrible thing. It just means you need to put in more effort. Now strategy, creativity and understanding of the platform’s mechanics matter more. It’s not as easy, but it is more interesting.
How Gen Z Uses Instagram as a Search Engine in 2025
Younger generations are increasingly looking to the app as a discovery tool rather than just a social network: a greater proportion of Gen Z are now searching for restaurants, travel destinations, and product reviews on the platform as opposed to traditional search engines. A major shift in search habits that raises the question: is Instagram quietly becoming a visual search engine?
Why Saves Matter More Than Likes in 2025
For a long time, likes were the metric of choice, but today saves are a far more powerful measure of valuable content, especially for educational or evergreen content. Saved content has a higher chance of being resurfaced by the algorithm later on. In a way, saves show intent rather than just sentiment.
The Rise of Private Sharing: DMs Are the New Engagement Metric
While public engagement is declining, the proportion of content shared privately is on the rise. Much of the content on Instagram is now being shared via DM rather than being liked and commented on. This makes engagement much harder to track, but arguably much more valuable. Instagram is becoming as much a messaging app as it is a content app.
From Scroll to Checkout: Social Commerce Conversion Trends
The customer journey is getting shorter and shorter on Instagram. It’s now entirely possible for users to discover something and make a purchase in the space of minutes, and social commerce conversions are increasing year on year. It’s no surprise that visual-first content is driving this trend, as people want to see what they’re buying in action. The distinction between browsing and buying is getting increasingly blurred.
Influencer Marketing ROI in 2025: Are Brands Still Winning?
Despite increased saturation, influencer marketing is still returning strong results for brands on the platform. In 2025, many are seeing more value from partnering with micro-influencers than mainstream celebrities, with smaller, more engaged audiences continuing to perform better. Trust still drives conversions, and for many users micro-influencers feel more trustworthy. It’s less about reach and more about relevance.
Video vs Static Content: What’s Actually Winning in 2025?
Static content isn’t dead, but it’s certainly no longer king. Video, particularly in the form of Reels, is consistently outperforming static content when it comes to reach and impressions. It’s no secret that users are spending more time watching and less time scrolling. It’s a trend that mirrors the way we consume content elsewhere.
Best Times to Post in 2025: When Engagement Peaks
Even with an algorithm-driven feed, timing is still everything. The most engaging times to post are still early mornings, lunch breaks, and late evenings, but there is significant variation depending on geography and demographics. Posting at the right time won’t guarantee you success, but it can certainly give you a boost.
Do Hashtags Still Work? What’s Changed in 2025
Hashtags still have a role to play in 2025, but their function has evolved somewhat. Rather than simply increasing the volume of hashtags to boost reach, accounts are seeing more success by being strategic with how they use them, opting for a smaller number of more targeted, niche tags rather than dozens of more generic ones. In 2025, you’re more likely to be penalized for using too many hashtags than rewarded.
Organic vs Paid Growth: How Accounts Are Scaling Today
Organic growth is slowing down across the platform, and new accounts are having to work much harder to gain traction. In 2025, many accounts are using Reels and cross-promotion to speed up their growth rather than relying on more traditional growth strategies. For accounts that can afford it, paid growth is also a big driver, although it’s certainly no guarantee of long-term success.
Story Completion Rates: How Long Can You Hold Attention?
We know that posting Stories is one of the best ways to keep an audience engaged, but how long are they actually holding users’ attention for? Completion rates plummet as the number of frames increases, with shorter Story sequences performing significantly better. Users’ patience is short, and their attention spans shorter. The less you post, the more likely users are to see it.
Creator Burnout in 2025: The Hidden Side of Content Creation
One thing we don’t always consider when looking at content trends is the impact they’re having on creators themselves. Behind every beautifully shot image or rigorously researched caption is a real person, and for many of them, the pressure of constantly creating and adapting to algorithmic changes is taking its toll. In 2025, creator burnout is a rising concern.
Ad Fatigue on Social Media: Are Users Tuning Out?
As the volume of ads increases on the platform, users are understandably becoming increasingly resistant, as ad fatigue is a real and present danger for brands in 2025. Users are quick to dismiss ads that don’t chime with them, and repetitive or low-quality ads are particularly vulnerable. To stand out from the noise, brands need to prioritize creativity and authenticity. Blending seamlessly into users’ feeds has never been more important.
Multi-Platform Behavior: How Users Split Time Across Apps
Last but not least, let’s talk about how users are splitting their time across the various social platforms at their disposal. In 2025, it’s rare for a user to be active on just one platform, as users flit between Instagram, TikTok, YouTube and more throughout the day depending on what they need from them. For brands and creators, this makes a cohesive cross-platform strategy more important than ever, as users expect a joined-up experience no matter where they encounter a brand.
Key Takeaways
After looking at all these numbers, there’s one thing to keep in mind: Instagram isn’t slowing down, it’s just evolving. We’re seeing more plateaued growth, more competition, and more personal ways of consuming the app.
We have Reels for discovery, Stories for engagement, and ads for a money-making machine. Meanwhile, its users (particularly Gen Z) are shifting and molding the entire ecosystem every single day (without even realizing it).
Should you still care about Instagram in 2025? Absolutely. But it’s not the same umbrella platform it once was. Instead, it rewards those who experiment, who test and learn, and who understand that what worked yesterday won’t work today.
So maybe that’s the takeaway from all of this. Instagram isn’t just growing; it’s evolving. And whether you’re a creator, a brand, or a late-night scroll-er, you’re a part of that…even if you didn’t know it.


